Unlock a world of possibilities! Login now and discover the exclusive benefits awaiting you.
Announcements
April 13–15 - Dare to Unleash a New Professional You at Qlik Connect 2026: Register Now!
- Qlik Community
- :
- All Forums
- :
- QlikView App Dev
- :
- Plot Histogram Chart
Options
- Subscribe to RSS Feed
- Mark Topic as New
- Mark Topic as Read
- Float this Topic for Current User
- Bookmark
- Subscribe
- Mute
- Printer Friendly Page
Turn on suggestions
Auto-suggest helps you quickly narrow down your search results by suggesting possible matches as you type.
Showing results for
Not applicable
2011-12-11
02:54 PM
- Mark as New
- Bookmark
- Subscribe
- Mute
- Subscribe to RSS Feed
- Permalink
- Report Inappropriate Content
Plot Histogram Chart
Hi Guys,
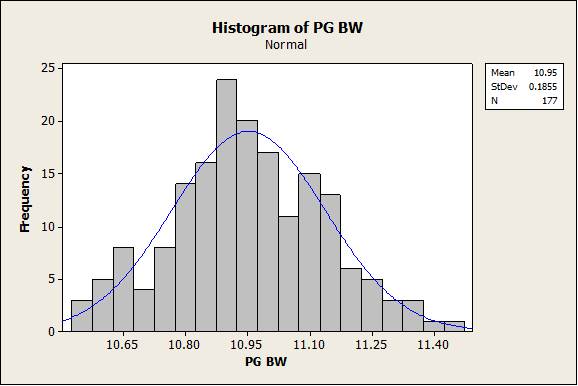
Does anyone knows how to plot a Statistical Histogram chart?
Thanks in advance,
Aldo.

3,354 Views
3 Replies
MVP
2011-12-11
03:32 PM
- Mark as New
- Bookmark
- Subscribe
- Mute
- Subscribe to RSS Feed
- Permalink
- Report Inappropriate Content
Not sure if this is what you are looking for, but please have a look at attached.
Regards,
Stefan
1,068 Views
Not applicable
2011-12-12
04:12 AM
Author
- Mark as New
- Bookmark
- Subscribe
- Mute
- Subscribe to RSS Feed
- Permalink
- Report Inappropriate Content
Hi Stefan,
It is what I am looking for, but in order to solve it, I need first to find a solution to the following post:
http://community.qlik.com/thread/40526
I'll let you know.
Thanks,
Aldo.
1,068 Views
Employee
2011-12-12
08:27 AM
- Mark as New
- Bookmark
- Subscribe
- Mute
- Subscribe to RSS Feed
- Permalink
- Report Inappropriate Content
1st step -
Create a dimension in your script with
load
subfield(Class(Expression1,10),' ', 1) as yournewdim
, [another fields]
Resident your_Data .
2st step -
Use this yournewdim inside your app and use count(yournewdim) as your expression.
1,068 Views