Unlock a world of possibilities! Login now and discover the exclusive benefits awaiting you.
- Qlik Community
- :
- All Forums
- :
- QlikView App Dev
- :
- Possible in QlikView? Polling activity in 10 minu...
- Subscribe to RSS Feed
- Mark Topic as New
- Mark Topic as Read
- Float this Topic for Current User
- Bookmark
- Subscribe
- Mute
- Printer Friendly Page
- Mark as New
- Bookmark
- Subscribe
- Mute
- Subscribe to RSS Feed
- Permalink
- Report Inappropriate Content
Possible in QlikView? Polling activity in 10 minute blocks
this is what i can produce

It shows when an activity is scheduled to start and the duration of the activity.
However what I would really like is that the chart to show what is happening every 5 or 10 minutes.
so for example red activity starts at 12:40 and is scheduled to go for 15 minutes
I would like it to show something like:
12:40 red activity
12:45 red activity
12:50 red activity
12:55 red activity
13:00
13:05 green activity
13:10 green activity
13:15 green activity
Thank you
Jo
- Mark as New
- Bookmark
- Subscribe
- Mute
- Subscribe to RSS Feed
- Permalink
- Report Inappropriate Content
As far as I understood, your current Model is built in the following way:
| Activity | Time | Duration [min] |
|---|---|---|
| red | 12:40 | 15 |
| green | 13:05 | 20 |
and you would like to decompose it in the following way:
| Activity | Timestamp |
|---|---|
| red | 12:40 |
| red | 12:45 |
| red | 12:50 |
| red | 12:55 |
| null | |
| green | 13:05 |
| etc. | etc. |
This will require you to rebuild the data model in the backend script, including a generic Timestamp to ensure the nulls exist.
- Mark as New
- Bookmark
- Subscribe
- Mute
- Subscribe to RSS Feed
- Permalink
- Report Inappropriate Content
Hi,
maybe one solution could be:
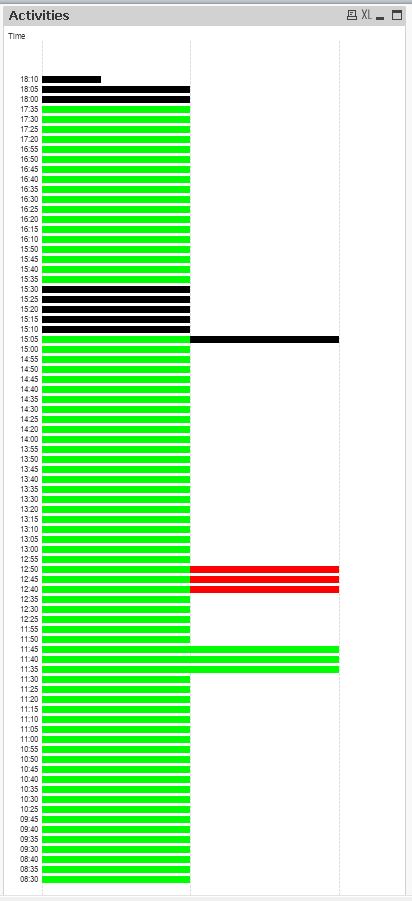
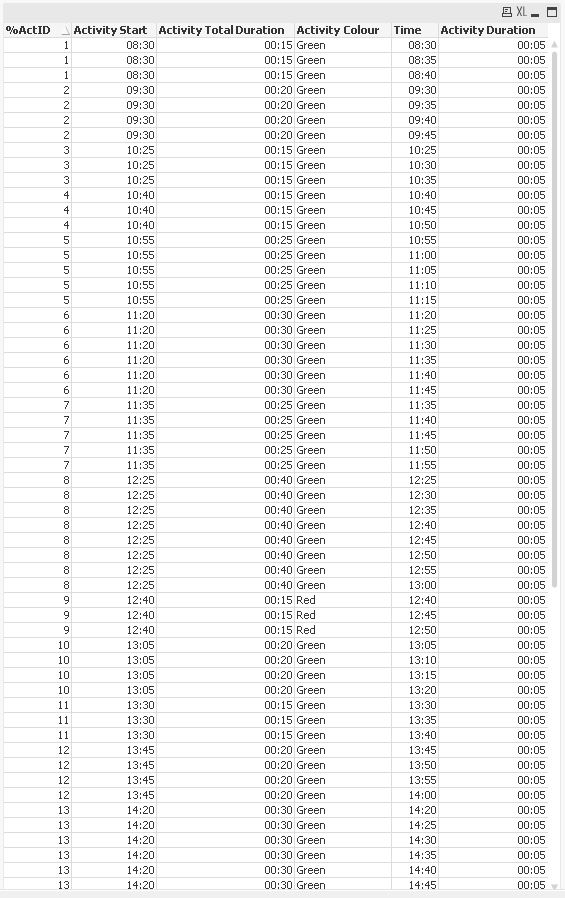
table1:
LOAD RecNo() as %ActID,
    Time#([Activity Start],'hh:mm') as [Activity Start],
    Interval(Interval#([Activity Total Duration],'m'),'hh:mm') as [Activity Total Duration],
    [Activity Colour]
Inline [
Activity Start, Activity Total Duration, Activity Colour
08:30, 15, Green
09:30, 20, Green
10:25, 15, Green
10:40, 15, Green
10:55, 25, Green
11:20, 30, Green
11:35, 25, Green
12:25, 40, Green
12:40, 15, Red
13:05, 20, Green
13:30, 15, Green
13:45, 20, Green
14:20, 30, Green
14:50, 20, Green
15:05, 30, Black
15:35, 20, Green
16:10, 30, Green
16:40, 20, Green
17:20, 20, Green
18:00, 12, Black
];

table2:
LOAD %ActID,
    Time,
    Interval#(Interval(RangeMax(RangeMin([Activity End],Time+'00:05')-RangeMax([Activity Start],Time),0),'hh:mm'),'hh:mm') as [Activity Duration];
LOAD %ActID,
    Time#(Time(Floor([Activity Start],'00:05')+(IterNo()-1)*'00:05','hh:mm'),'hh:mm') as Time,
    [Activity Start],
    [Activity Start]+[Activity Total Duration] as [Activity End]
Resident table1
While Time#(Time(Floor([Activity Start],'00:05')+(IterNo()-1)*'00:05','hh:mm'),'hh:mm')<Time#(Time([Activity Start]+[Activity Total Duration],'hh:mm'),'hh:mm');
hope this helps
regards
Marco
- Mark as New
- Bookmark
- Subscribe
- Mute
- Subscribe to RSS Feed
- Permalink
- Report Inappropriate Content
yes I see what you mean - I have now looked at the type of formula build I would need. I am thinking ...
- Mark as New
- Bookmark
- Subscribe
- Mute
- Subscribe to RSS Feed
- Permalink
- Report Inappropriate Content
I thought I had replied ... but lost it.
anyway
in my head i need something like this:
| Act ID | Activity Start | Activity Duration | Duration | Activity end | Act ID & Activity End Flag |
| 1 | 8:30 | 15 | 0 | 8:30 | 1y |
| 1 | 8:30 | 15 | 5 | 8:35 | 1y |
| 1 | 8:30 | 15 | 5 | 8:40 | 1y |
| 1 | 8:30 | 15 | 5 | 8:45 | 1y |
| 2 | 9:00 | 10 | 0 | 9:00 | 2y |
| 2 | 9:00 | 10 | 10 | 9:05 | 2y |
| 2 | 9:00 | 10 | 10 | 9:10 | 2y |
| 9:15 | null null | ||||
| 9:20 | null null | ||||
| 9:25 | null null | ||||
| 9:30 | null null | ||||
| 9:45 | null null | ||||
| 9:50 | null null | ||||
| 9:55 | null null | ||||
| 3 | 10:00 | 60 | 0 | 10:00 | 3y |
| 3 | 10:00 | 60 | 60 | 10:05 | 3y |
| 3 | 10:00 | 60 | 60 | 10:10 | 3y |
| 3 | 10:00 | 60 | 60 | 10:15 | 3y |
| 3 | 10:00 | 60 | 60 | 10:20 | 3y |
| 3 | 10:00 | 60 | 60 | 10:25 | 3y |
| 3 | 10:00 | 60 | 60 | 10:30 | 3y |
| 3 | 10:00 | 60 | 60 | 10:35 | 3y |
| 3 | 10:00 | 60 | 60 | 10:40 | 3y |
| 3 | 10:00 | 60 | 60 | 10:45 | 3y |
| 3 | 10:00 | 60 | 60 | 10:50 | 3y |
| 3 | 10:00 | 60 | 60 | 10:55 | 3y |
| 3 | 10:00 | 60 | 60 | 11:00 | 3y |
the x axis would be the (Activity end)
the y axis would the (ActID + Activity End Flag)
- the flag would be if ( [Activity Start] + [Duration]) <( [Activity Start] + [Activity Duration]) then flag = y
Marco - before I go any further I am going to look at your formulas. I will need to write them out to understand what is happening.
Thank you for your help so far - will write again.
Jo
- Mark as New
- Bookmark
- Subscribe
- Mute
- Subscribe to RSS Feed
- Permalink
- Report Inappropriate Content
maybe looking at your reply Marco I could do something like divide the an activity duration by 5 (that will give me how many times i need to show the activity once started)