Unlock a world of possibilities! Login now and discover the exclusive benefits awaiting you.
- Qlik Community
- :
- All Forums
- :
- QlikView App Dev
- :
- Predefine values for an expression
- Subscribe to RSS Feed
- Mark Topic as New
- Mark Topic as Read
- Float this Topic for Current User
- Bookmark
- Subscribe
- Mute
- Printer Friendly Page
- Mark as New
- Bookmark
- Subscribe
- Mute
- Subscribe to RSS Feed
- Permalink
- Report Inappropriate Content
Predefine values for an expression
Hi,
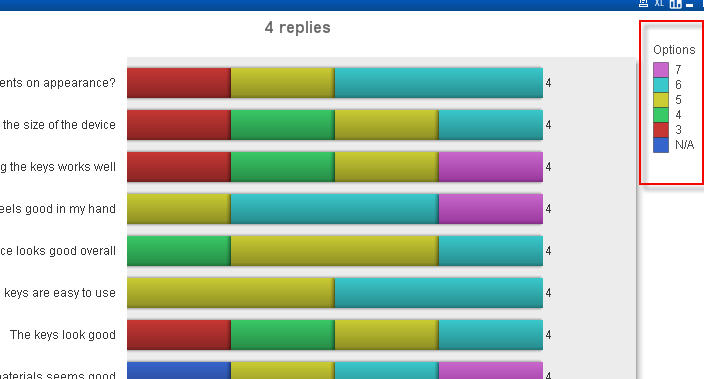
I got a chart like the attached. The chart is build of data from a quiestionnaire. The chart displayes a "group" of questions. The options in the questions goes from 1 to X.
The "option" values in this example are: 3, 4, 5, ,6, 7 and n/a. I would like to have the options 1 and 2 displayed as well even though it has not been selected as an answer. Reason: to show all possible answer options also those that are not chosen. That way the "colors codes" for each option should remain the same always, which will also make the chart easier/faster to read.
For the each question the MIN and MAX is defined in a field that is loaded to QlikView. All questions for one "question group" will have the same MIN and MAX, meaning there cannot be a situation where one question will have MAX=5 and another MAX=7.
So how do I make the "option" values in the chart always go from MIN to MAX?
Appriciate your help
Nikolaj
- Mark as New
- Bookmark
- Subscribe
- Mute
- Subscribe to RSS Feed
- Permalink
- Report Inappropriate Content
Hi
If your data model includes answers 1 & 2 even though they haven't been selected then it should be possible, you probably need to un-check the boxes against Suppress zero values and Suppress missing values (this is in the presentation tab of the chart properties).
Good luck,
- Mark as New
- Bookmark
- Subscribe
- Mute
- Subscribe to RSS Feed
- Permalink
- Report Inappropriate Content
Ni Nigel,
thanks for your reply. We cannot be sure that the data model will contain options 1&2. That means I cannot use your suggestion 😞
I need to predefine the "options" for the chart somehow?
Regards
Nik