Unlock a world of possibilities! Login now and discover the exclusive benefits awaiting you.
- Qlik Community
- :
- All Forums
- :
- QlikView App Dev
- :
- Problem Bar chart
- Subscribe to RSS Feed
- Mark Topic as New
- Mark Topic as Read
- Float this Topic for Current User
- Bookmark
- Subscribe
- Mute
- Printer Friendly Page
- Mark as New
- Bookmark
- Subscribe
- Mute
- Subscribe to RSS Feed
- Permalink
- Report Inappropriate Content
Problem Bar chart
Hi Frnz,
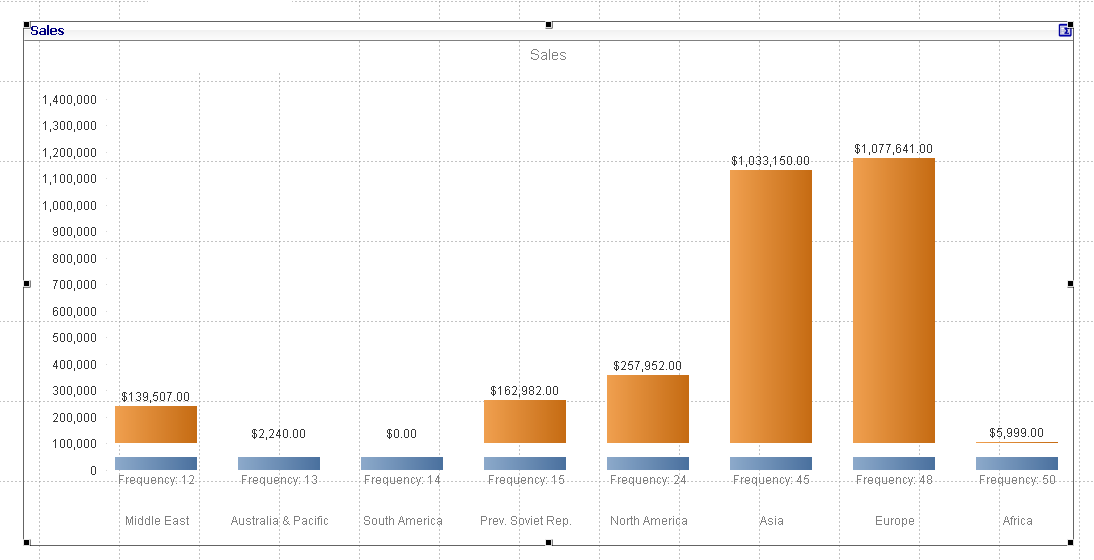
I have attached one image.I would like to show Bars like in that image. Is it possible to show like this ?
Accepted Solutions
- Mark as New
- Bookmark
- Subscribe
- Mute
- Subscribe to RSS Feed
- Permalink
- Report Inappropriate Content
- Mark as New
- Bookmark
- Subscribe
- Mute
- Subscribe to RSS Feed
- Permalink
- Report Inappropriate Content
Are the bootom blue line a part of the same bar or a new bar?
What do they represent?
You can always play with putting one object on another.
make some part of the second object transparent to get similar result
- Mark as New
- Bookmark
- Subscribe
- Mute
- Subscribe to RSS Feed
- Permalink
- Report Inappropriate Content
Hi, not exactly the same but one workaround can be creating an expression that returns that string and check the option 'Text in axis' (and uncheck any other presentation option)
- Mark as New
- Bookmark
- Subscribe
- Mute
- Subscribe to RSS Feed
- Permalink
- Report Inappropriate Content
pls clarify a bit more as Rob asked above?
seems to be one bar,because of 2'nd y-axis values are not matching if't different it should be match.
- Mark as New
- Bookmark
- Subscribe
- Mute
- Subscribe to RSS Feed
- Permalink
- Report Inappropriate Content
THis is an approximation
- Mark as New
- Bookmark
- Subscribe
- Mute
- Subscribe to RSS Feed
- Permalink
- Report Inappropriate Content
is the bottom bar of the 2 sets of bars always the same value? In the png and qvw it looks like the value of the bottom bar all have the same value?
what is it that you ar trying to show? Would a combo chart show the message better or a bar chart and reference line?
- Mark as New
- Bookmark
- Subscribe
- Mute
- Subscribe to RSS Feed
- Permalink
- Report Inappropriate Content
Hi All,
Sorry for delay reply. Here for 2 expressions , i have to show 2 bars. Any chart type is fine, but we need to show like this.
- Mark as New
- Bookmark
- Subscribe
- Mute
- Subscribe to RSS Feed
- Permalink
- Report Inappropriate Content
hi Jonathan,
Yes. My requirement is like this. I have 2 expressions, i need to show like this. Please let me know how to do it.
- Mark as New
- Bookmark
- Subscribe
- Mute
- Subscribe to RSS Feed
- Permalink
- Report Inappropriate Content
Hi Jonathan,
Thanks for your solution. It is working. But I didn't get bar for Frequency. Can you please help me in this.
- Mark as New
- Bookmark
- Subscribe
- Mute
- Subscribe to RSS Feed
- Permalink
- Report Inappropriate Content
Can you show me a screenshot of what you accomplished and what is missing ?