Unlock a world of possibilities! Login now and discover the exclusive benefits awaiting you.
- Qlik Community
- :
- All Forums
- :
- QlikView App Dev
- :
- Problem calculated dimension, bar chart!
- Subscribe to RSS Feed
- Mark Topic as New
- Mark Topic as Read
- Float this Topic for Current User
- Bookmark
- Subscribe
- Mute
- Printer Friendly Page
- Mark as New
- Bookmark
- Subscribe
- Mute
- Subscribe to RSS Feed
- Permalink
- Report Inappropriate Content
Problem calculated dimension, bar chart!
Hi all!
I'm developing apps in Qlikview for about 2 month and today i bumped into a small problem. I'm trying to create simple bar chart from table looking like this:
| id | name | id_portfolio | type |
|---|---|---|---|
| 111 | one | 333 | 1 |
| 222 | two | 444 | 1 |
| 333 | portfolio1 | 2 | |
| 444 | portfolio2 | 2 | |
| 555 | three | 444 | 1 |
| 666 | four | 444 | 1 |
| 777 | five | 444 | 1 |
| 888 | six | 333 | 1 |
i created something like this:
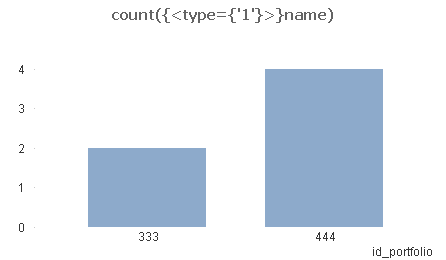
but in the dimension i need name of id_portfolio (instead of 333 -> portfolio1 and 444->portfolio2), but i don't want to use name as dimension, because the chart is counted correctly. I've tried aggr functions, almost everything 
I think that's solution is very easy, but i can't figure it out.
Thanks in advance.
Jacek Mossakowski
- Mark as New
- Bookmark
- Subscribe
- Mute
- Subscribe to RSS Feed
- Permalink
- Report Inappropriate Content
could you share your qvw?
- Mark as New
- Bookmark
- Subscribe
- Mute
- Subscribe to RSS Feed
- Permalink
- Report Inappropriate Content
Just load two tables instead of one, first with name an id aliased as id_portfolio, second with id_portfolio and type. The two tables shpuld link by id_portfolio. Then create a chart with your expression and dimension name.
edit: Here is the little script:
LOAD id as id_portfolio,
name
FROM
[http://community.qlik.com/thread/120567]
(html, codepage is 1252, embedded labels, table is @1);
LOAD
id_portfolio,
type
FROM
[http://community.qlik.com/thread/120567]
(html, codepage is 1252, embedded labels, table is @1);
Then create bar chart with dimension name and as expression:
=count({<type = {1}>} type)
- Mark as New
- Bookmark
- Subscribe
- Mute
- Subscribe to RSS Feed
- Permalink
- Report Inappropriate Content
Hi Jacek,
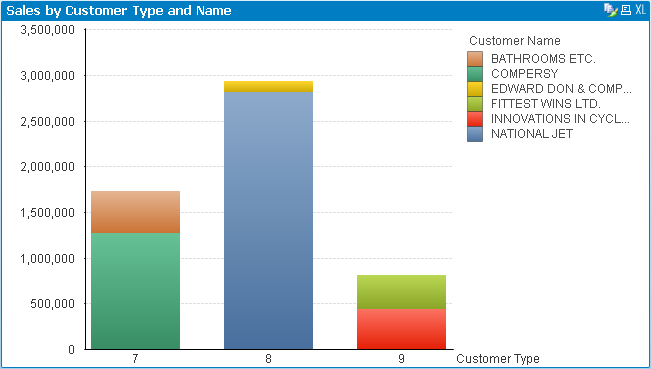
Here is an alternative way to view the data:
On the bar chart, select "id_portfolio" as your first dimension, and select "name" as your second dimension. Go to the style tab in chart properties, and select "stacked" on the subtype. This will show the same information as the chart above, but will give you insight on two dimensions instead of one.
Example:
Cheers!
Sean
- Mark as New
- Bookmark
- Subscribe
- Mute
- Subscribe to RSS Feed
- Permalink
- Report Inappropriate Content
Is the above one a single table or 2 different tables? is there a parent child relationship between id and id_portfolio? it looks like there is a self referencing hierarchy b/w them. In this case you have to use hierarchy function to define this table. I have attached the same here using the data you gave.
- Mark as New
- Bookmark
- Subscribe
- Mute
- Subscribe to RSS Feed
- Permalink
- Report Inappropriate Content
Jacek,
wg mnie lepszy będzie model:
table_a:
| id | name | id_portfolio |
| 111 | one | 333 |
| 222 | two | 444 |
| 555 | three | 444 |
| 666 | four | 444 |
| 777 | five | 444 |
| 888 | six | 333 |
table_b:
| id_portfolio | portfolio_name |
| 333 | portfolio1 |
| 444 | portfolio2 |
ewentualnie można złączyć tabele a i b do jednej:
| id | name | id_portfolio | portfolio_name |
| 111 | one | 333 | portfolio1 |
| 222 | two | 444 | portfolio2 |
| 555 | three | 444 | portfolio2 |
| 666 | four | 444 | portfolio2 |
| 777 | five | 444 | portfolio2 |
| 888 | six | 333 | portfolio1 |
W obydwu przypadkach możesz użyć portfolio_name jako wymiaru.
pozdrawiam
Darek
- Mark as New
- Bookmark
- Subscribe
- Mute
- Subscribe to RSS Feed
- Permalink
- Report Inappropriate Content
I thought that there is a possibility to aggregate somehow id_portfolio and id  But i think that there is only one correct way - make two tables.
Thanks guys!
- Mark as New
- Bookmark
- Subscribe
- Mute
- Subscribe to RSS Feed
- Permalink
- Report Inappropriate Content
Jacek,
in fact data model creation deppends on many factors. It is difficult to decide seeing only part of data ond KPI's, knowing not data volume etc.
For example in your case, assuming that the only one feature of portfolio is its name and the only function of portfolio_id is make connection from fact to portfolio_name, my recomendation is to put portfolio_name into fact table and drop field portfolio_id. In fact, especially with bigger data volumes less tables is better because there is less time needed to propagate selections and join during calculations. QV in general stores 2 things for each field. Its distinct values and binary index. In your example portfolio name has 2 values, so QV may use 1 bit for storing its value for each row. This is why sometimes (when your dimension is not wery wide) it may be better to put it as a field into fact table than have id and additional dimension table....
Of course, regardless of the volume, the data model must be correct and adapted to the needs of the analysis. From my experience in applications with volumes of 10 million + details are beginning to be felt for processing time. In my application built for the largest volume of 800 million records every detail of the model had a significant impact on processing times and optimize it from the very beginning one of the most important topics in the project.
regards
Darek