Unlock a world of possibilities! Login now and discover the exclusive benefits awaiting you.
- Qlik Community
- :
- All Forums
- :
- QlikView App Dev
- :
- Problem loading Stacked Chart
- Subscribe to RSS Feed
- Mark Topic as New
- Mark Topic as Read
- Float this Topic for Current User
- Bookmark
- Subscribe
- Mute
- Printer Friendly Page
- Mark as New
- Bookmark
- Subscribe
- Mute
- Subscribe to RSS Feed
- Permalink
- Report Inappropriate Content
Problem loading Stacked Chart
Hi,
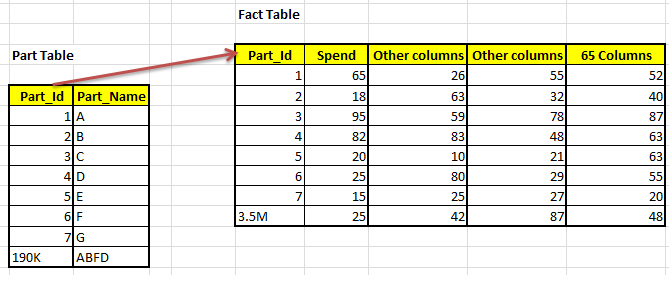
We are using stacked chart with dynamic dimensions with simple expressions sum(spend) and relative spend showing top 10. It is working fine so far with less amount of data. But now data is increased, one dimension has 190K rows and the fact table has 3.5M rows. we are using star schema.
With this amount of data chart is not loading in UI and Access Point.
can someone give suggestions to fix this problem?
Thanks for your support.
Regards,
Sai Krishna.
Accepted Solutions
- Mark as New
- Bookmark
- Subscribe
- Mute
- Subscribe to RSS Feed
- Permalink
- Report Inappropriate Content
Which method to show Top10 are you using?
Have you tried limiting your data using set analysis?
QlikView Blog Q-Tip #5 – Show Top Performers. Common but not too trivial. | Natural Synergies
- Mark as New
- Bookmark
- Subscribe
- Mute
- Subscribe to RSS Feed
- Permalink
- Report Inappropriate Content
Hi, Thank You for sharing the link. It improved performance lot. But am facing issue with label.
I am using drill down group in derived expression. So can you please help me to set the label for the dimension.
- Mark as New
- Bookmark
- Subscribe
- Mute
- Subscribe to RSS Feed
- Permalink
- Report Inappropriate Content
Could you elaborate more what the issue with the label is?
- Mark as New
- Bookmark
- Subscribe
- Mute
- Subscribe to RSS Feed
- Permalink
- Report Inappropriate Content
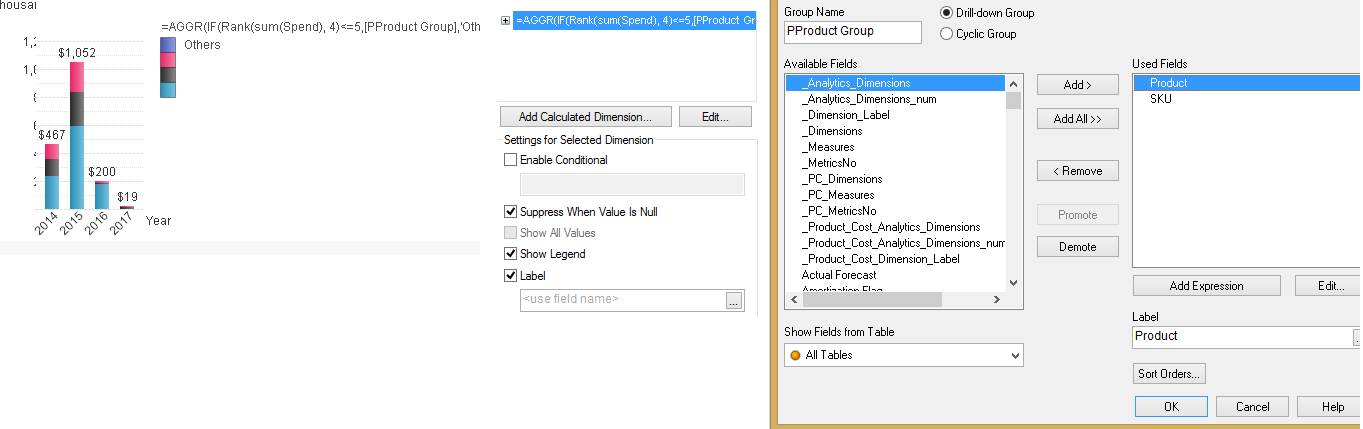
I have a drilldown group "PProduct Group" with SKU and Product.
When I use [PProduct Group] as dimension, label is displayed properly, SKU and Product based on selection. But when I use calculated dimension like "=AGGR(IF(Rank(sum(Spend), 4)<=5,[PProduct Group],'Others'), [PProduct Group])" label is not displaying properly.
Need solution for legend label to display properly. Thanks in Advance.
- Mark as New
- Bookmark
- Subscribe
- Mute
- Subscribe to RSS Feed
- Permalink
- Report Inappropriate Content
Have you tried setting a label?
 (1).q.png)
- Mark as New
- Bookmark
- Subscribe
- Mute
- Subscribe to RSS Feed
- Permalink
- Report Inappropriate Content
Yes. I have tried it. Still not working. Please let me know if I am missing somethings.
- Mark as New
- Bookmark
- Subscribe
- Mute
- Subscribe to RSS Feed
- Permalink
- Report Inappropriate Content
Hi,
I got solution, thanks for all help.
GetCurrentField(<Group Name>) is used in label expression.