Unlock a world of possibilities! Login now and discover the exclusive benefits awaiting you.
- Qlik Community
- :
- All Forums
- :
- QlikView App Dev
- :
- Problem using chart formula in a text box
- Subscribe to RSS Feed
- Mark Topic as New
- Mark Topic as Read
- Float this Topic for Current User
- Bookmark
- Subscribe
- Mute
- Printer Friendly Page
- Mark as New
- Bookmark
- Subscribe
- Mute
- Subscribe to RSS Feed
- Permalink
- Report Inappropriate Content
Problem using chart formula in a text box
Hello everyone,
It must be right in from of my eyes but, somehow, I cannot see it. Can someone please show me what I am missing?...
Here is my problem:
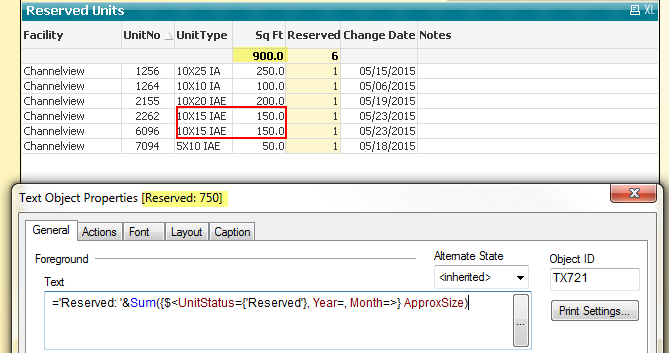
I copied a formula from a chart to perform a new calcuation in a text box but, the result from the text box (750) is different that the one in the chart (900). I noticed that the text box is only adding distinct values for Unit Type. I have tried to adjust the Text Box formula in different ways to include all UnitType items but I have been unsuccesful, I must be using them the wrong way.
How can I modified the formula in the Text Box so that, I get the same result as in the chart?
The dimensions in the chart are: Facility, UnitNo, UnitType.
Thanks in advance for your advise.
M. Gavidia
Accepted Solutions
- Mark as New
- Bookmark
- Subscribe
- Mute
- Subscribe to RSS Feed
- Permalink
- Report Inappropriate Content
SUM(Aggr(SUM({<UnitStatus = {'Reserved'}, Year=, Month= >}ApproxSize),UnitType,UnitNo))
- Mark as New
- Bookmark
- Subscribe
- Mute
- Subscribe to RSS Feed
- Permalink
- Report Inappropriate Content
Please post sample app/data.
thanks
regards
Marco
- Mark as New
- Bookmark
- Subscribe
- Mute
- Subscribe to RSS Feed
- Permalink
- Report Inappropriate Content
SUM(Aggr(SUM({<UnitStatus = {'Reserved'}, Year=, Month= >}ApproxSize),UnitType,UnitNo))
- Mark as New
- Bookmark
- Subscribe
- Mute
- Subscribe to RSS Feed
- Permalink
- Report Inappropriate Content
Manish,
Your formula above gave me the right results.
Well, I figured I needed to use the Aggr function but as, I mentioned, I must have been using it wrong.
Thanks a lot!
Miguel Gavidia