Unlock a world of possibilities! Login now and discover the exclusive benefits awaiting you.
- Qlik Community
- :
- All Forums
- :
- QlikView App Dev
- :
- Problem with aggr max in straight table
- Subscribe to RSS Feed
- Mark Topic as New
- Mark Topic as Read
- Float this Topic for Current User
- Bookmark
- Subscribe
- Mute
- Printer Friendly Page
- Mark as New
- Bookmark
- Subscribe
- Mute
- Subscribe to RSS Feed
- Permalink
- Report Inappropriate Content
Problem with aggr max in straight table
Hello dear community,
I'm stuck on a silly problem.
I have the following table:
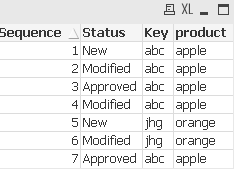
In a straight table I wish to display only the lines which confirm to the following rule:
Max of sequence for a given key.
I tried aggr(max(Sequence),Key), but it is for some weird reason picking out line 1 and 5.
Attached a sample app.
Thank you in advance for getting me unstuck!
Cheers
- « Previous Replies
- Next Replies »
- Mark as New
- Bookmark
- Subscribe
- Mute
- Subscribe to RSS Feed
- Permalink
- Report Inappropriate Content
Test1:
LOAD Sequence,
Status,
Key,
product
FROM
D:\Users\hz9ybh\Desktop\test.xls
(biff, embedded labels, table is Sheet1$);
left join(Test1)
load Key, Max(Sequence) as maxSequence resident Test1 group by Key;
Test:
load *, if(Sequence = maxSequence,1,0) as isMaxSequence resident Test1;
Drop table Test1;
Then use isMaxSequence in your set analysis. So if you want the Sum of Value for these lines you write :
Sum({<isMaxSequence ={1}>} Value)
If you dont need the other sequences in your data model at all then you can add a Where clause to the last load:
Test:
load * resident Test1 where Sequence = maxSequence
;
- Mark as New
- Bookmark
- Subscribe
- Mute
- Subscribe to RSS Feed
- Permalink
- Report Inappropriate Content
It works, but i'm still looking for a way to do it only with expressions in the chart.
hmmm .. thank you!
- Mark as New
- Bookmark
- Subscribe
- Mute
- Subscribe to RSS Feed
- Permalink
- Report Inappropriate Content
Try
the attached file and see if it helps
- Mark as New
- Bookmark
- Subscribe
- Mute
- Subscribe to RSS Feed
- Permalink
- Report Inappropriate Content
Hi,
Suggestion provided by Simen Kind Gulbrandsen. THe solution pushes most of calculation to script and a lighter UI and it's dynamic.
- Mark as New
- Bookmark
- Subscribe
- Mute
- Subscribe to RSS Feed
- Permalink
- Report Inappropriate Content
Status is still wrong 
- Mark as New
- Bookmark
- Subscribe
- Mute
- Subscribe to RSS Feed
- Permalink
- Report Inappropriate Content
Using dynamic update in app, so not possible to reload app...
- Mark as New
- Bookmark
- Subscribe
- Mute
- Subscribe to RSS Feed
- Permalink
- Report Inappropriate Content
Hi,
I dont think so.
Regards
Please appreciate our Qlik community members by giving Kudos for sharing their time for your query. If your query is answered, please mark the topic as resolved 🙂
- « Previous Replies
- Next Replies »