Unlock a world of possibilities! Login now and discover the exclusive benefits awaiting you.
- Qlik Community
- :
- All Forums
- :
- QlikView App Dev
- :
- Problem with application size
- Subscribe to RSS Feed
- Mark Topic as New
- Mark Topic as Read
- Float this Topic for Current User
- Bookmark
- Subscribe
- Mute
- Printer Friendly Page
- Mark as New
- Bookmark
- Subscribe
- Mute
- Subscribe to RSS Feed
- Permalink
- Report Inappropriate Content
Problem with application size
Hello,
I have an application. When I save the application without compression, the application is approx 175 MB.
I opened the application with a DocumentAnalyser (thank you Rob), and it says that the Table is 165 MB.
--> ok, the layout and other compotents take about 10 MB, that sounds OK.
Now, I add just 1 new table (no relation with the others), with only 1 line, from an Excel file.
When saved,my application is now 225 MB!
With the DocumentAnalyser, it still says that the Table is 165 MB (few bytes more, because of the new line).
I don't understand why a few bytes increase the size of the application by 50 MB.
- « Previous Replies
-
- 1
- 2
- Next Replies »
- Mark as New
- Bookmark
- Subscribe
- Mute
- Subscribe to RSS Feed
- Permalink
- Report Inappropriate Content
If I add at the end of my application:
TMP:
LOAD * INLINE [
foo, bar
];
--> 175 MB (not compressed).
If instead I add at the end of my application:
TMP:
LOAD * INLINE [
foo, bar
1, 2
];
--> 225 MB (not compressed).
- Mark as New
- Bookmark
- Subscribe
- Mute
- Subscribe to RSS Feed
- Permalink
- Report Inappropriate Content
Are foo, bar related to other fields in your app?
- Mark as New
- Bookmark
- Subscribe
- Mute
- Subscribe to RSS Feed
- Permalink
- Report Inappropriate Content
Or, maybe there is another logical table that contains both foo and bar - so the new table creates a synthetic table (?)
- Mark as New
- Bookmark
- Subscribe
- Mute
- Subscribe to RSS Feed
- Permalink
- Report Inappropriate Content
No, as I said in my first post, there is no relation with any other table.
- Mark as New
- Bookmark
- Subscribe
- Mute
- Subscribe to RSS Feed
- Permalink
- Report Inappropriate Content
Would you mind posting those info?
1) Table Viewer screenshot
2) Document Properties / Tables
- Mark as New
- Bookmark
- Subscribe
- Mute
- Subscribe to RSS Feed
- Permalink
- Report Inappropriate Content
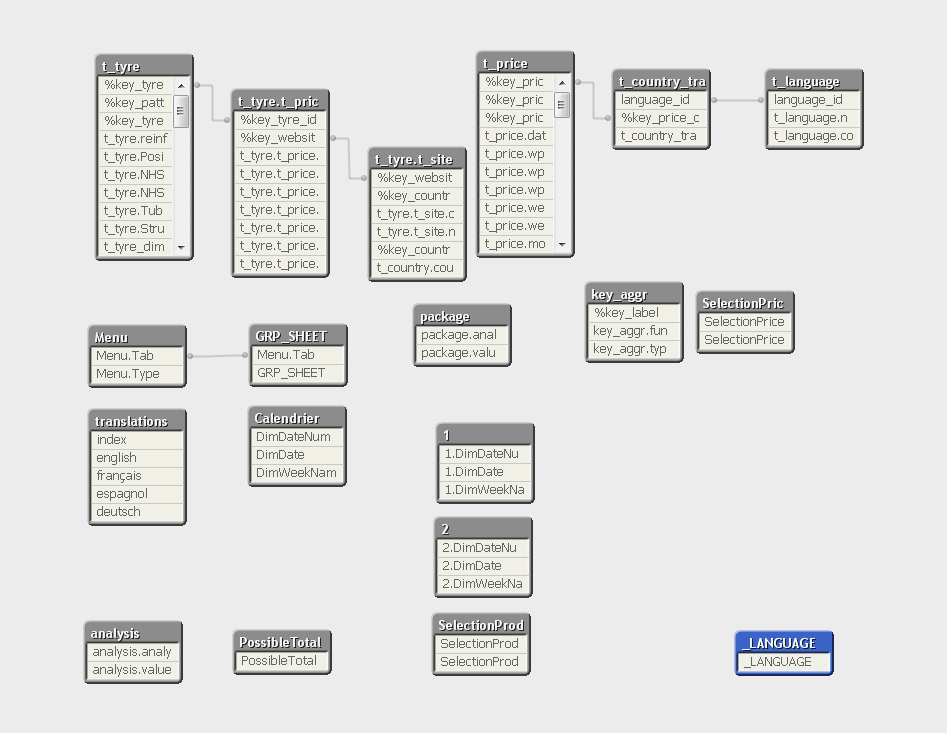
Here is my table viewer:

The table "_LANGUAGE" should contain 4 values "english / french / spanish / german", in order to choose the labels on charts.
If there is no line in the _LANGUAGE, my application "test - language without line.qvw" is 176'560 KB.
_LANGUAGE:
LOAD * INLINE [
_LANGUAGE
];
With the "mem" file, I see it should be 174 597 848 Bytes. --> no many differences
If there is 1 line in the _LANGUAGE, my application "test - language with 1 line.qvw" is 227'334 KB.
_LANGUAGE:
LOAD * INLINE [
_LANGUAGE
english
];
With the "mem" file, I see it should be 174 597 935 Bytes. --> many difference
See attached file "QlikOptimizer.qvw" to see de differences between the 2 files.
I don't explain the gap between my 2 versions of the application.
- Mark as New
- Bookmark
- Subscribe
- Mute
- Subscribe to RSS Feed
- Permalink
- Report Inappropriate Content
Hi!
As you may know there is very helpful post Symbol Tables and Bit-Stuffed Pointers on how Qlik handles the data. Moreover, please export memory usage statistics from first version app (175 mb) and second app (225 mb). You can do that from General tab of properties, button Memory Statistics.
Compare the data values (load stats into Qlik), possibly it could help to understand which field or table is gaining weight with load inline.
- Mark as New
- Bookmark
- Subscribe
- Mute
- Subscribe to RSS Feed
- Permalink
- Report Inappropriate Content
please export memory usage statistics from first version app (175 mb) and second app (225 mb)
That's what I have done in my previous post, and I loaded the both "mem" files in the application "QlikOptimizer" and created a chart to compare the two applications.
As I said, my first application (175 MB) have 174 597 848 Bytes of data, whereas my second application (225 MB) have 174 597 935 Bytes of data.
- Mark as New
- Bookmark
- Subscribe
- Mute
- Subscribe to RSS Feed
- Permalink
- Report Inappropriate Content
The question is to compare both of files, are the fileds and sizes are equal. Where are the peeks?
By the way you publish exact amount or amount on hard drive?
- « Previous Replies
-
- 1
- 2
- Next Replies »