Unlock a world of possibilities! Login now and discover the exclusive benefits awaiting you.
- Qlik Community
- :
- All Forums
- :
- QlikView App Dev
- :
- Problem with creating grouped bar chart
- Subscribe to RSS Feed
- Mark Topic as New
- Mark Topic as Read
- Float this Topic for Current User
- Bookmark
- Subscribe
- Mute
- Printer Friendly Page
- Mark as New
- Bookmark
- Subscribe
- Mute
- Subscribe to RSS Feed
- Permalink
- Report Inappropriate Content
Problem with creating grouped bar chart
Hi I have a question,
I want to show a bar chart with 3 dimension (GROUP, BRAND, DESC)
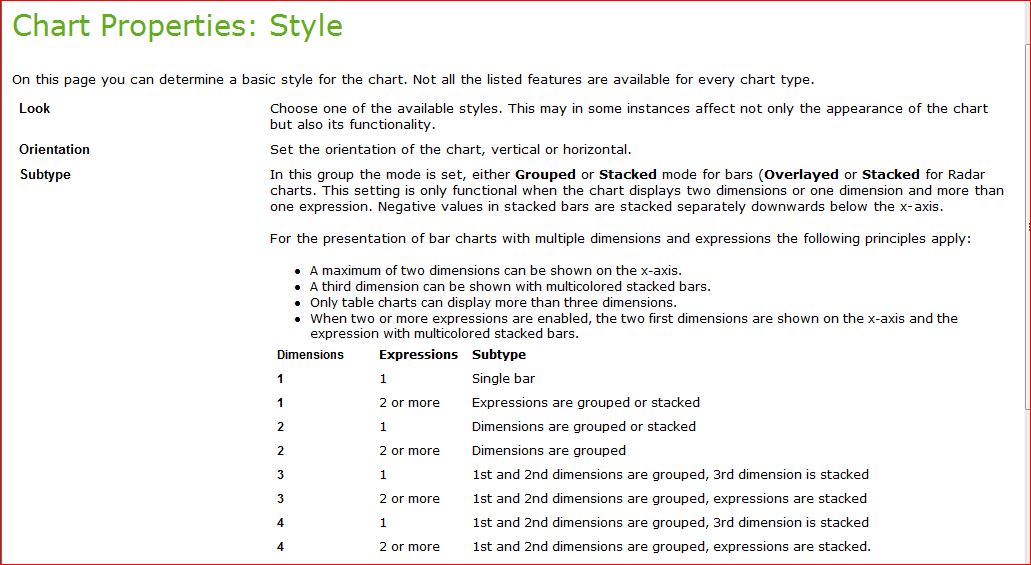
But when i go to Style--> subtype , i can't choose "grouped", and it create stack bar chart by default.
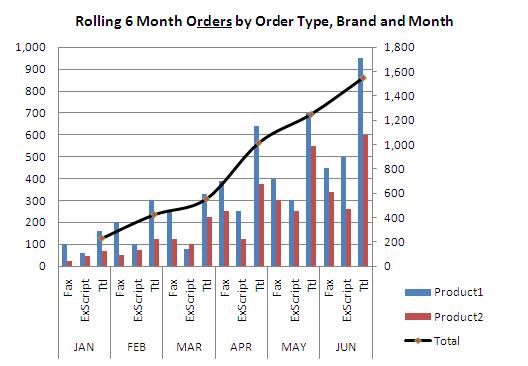
I want to show a chart like this :
I also attach my sample qlikview file and data source.
Really appreciate your help.
Thanks in advance.
- Mark as New
- Bookmark
- Subscribe
- Mute
- Subscribe to RSS Feed
- Permalink
- Report Inappropriate Content
Hi,
May be Like this?
- Mark as New
- Bookmark
- Subscribe
- Mute
- Subscribe to RSS Feed
- Permalink
- Report Inappropriate Content
Hi,
If you have third dimension in the bar chart by default it will stack the third dimension, and the options (Stacked & Grouped) are disabled.
Regards,
jagan.
- Mark as New
- Bookmark
- Subscribe
- Mute
- Subscribe to RSS Feed
- Permalink
- Report Inappropriate Content
Hi Settu and Jagan,
Thanks for your reply,
So it is impossible to create grouped bar chart if i have 3 dimension ?
- Mark as New
- Bookmark
- Subscribe
- Mute
- Subscribe to RSS Feed
- Permalink
- Report Inappropriate Content
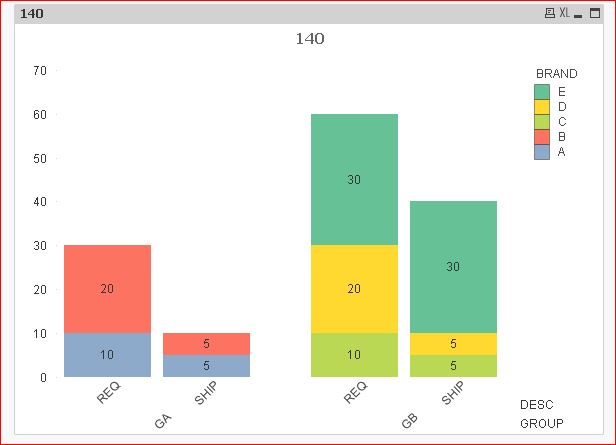
May be you can combine two dimension (Group & Brand ) into single and use it in your dimension.
Sample attached..
- Mark as New
- Bookmark
- Subscribe
- Mute
- Subscribe to RSS Feed
- Permalink
- Report Inappropriate Content
Wow, Great idea Settu.
Thanks for your idea.
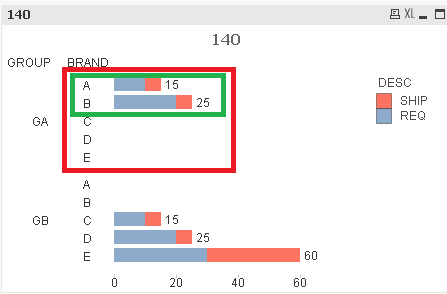
Another one question, why in GA and GB Group it shows all brand, actually GA only has Brand A and B, but it show Brand C,D, and E.
- Mark as New
- Bookmark
- Subscribe
- Mute
- Subscribe to RSS Feed
- Permalink
- Report Inappropriate Content
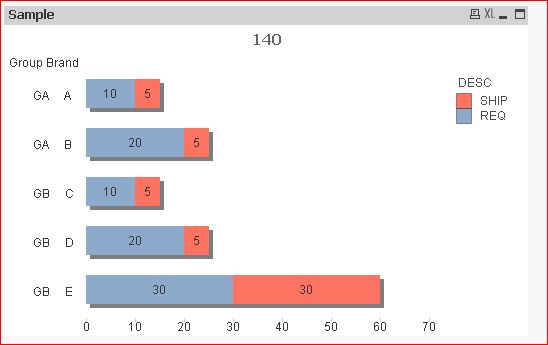
Hi,
This is the expected behaviour in Qv if we use 3 dimension. As suggested in previous thread you can combine those fields into single. It will look like this..
- Mark as New
- Bookmark
- Subscribe
- Mute
- Subscribe to RSS Feed
- Permalink
- Report Inappropriate Content
did you tried with the combo chart i.e, is the combination of the line and bar chart ??
- Mark as New
- Bookmark
- Subscribe
- Mute
- Subscribe to RSS Feed
- Permalink
- Report Inappropriate Content
Hi,
Check this,

Is this you require,You can go with combo Chart .
PFA,
HTH,
Hirish