Unlock a world of possibilities! Login now and discover the exclusive benefits awaiting you.
- Qlik Community
- :
- All Forums
- :
- QlikView App Dev
- :
- Problem with cummulation in line chart
- Subscribe to RSS Feed
- Mark Topic as New
- Mark Topic as Read
- Float this Topic for Current User
- Bookmark
- Subscribe
- Mute
- Printer Friendly Page
- Mark as New
- Bookmark
- Subscribe
- Mute
- Subscribe to RSS Feed
- Permalink
- Report Inappropriate Content
Problem with cummulation in line chart
Hello friends, I have problem with cummulation in graph.
Dimension is:
if([Finacial month] <= month(today()), [Finacial month] , null())
Expresion is:
Rangesum(above(Sum ({<[ID account] = , [Division] = {"VSC", "Zlievareň"} , $(vSetMaxFinancialYear) >}[Plan of Revenues]) -
Sum ({<[Financial transaction] = {"U99"}, [ID account] = , [Division] = {"VSC", "Zlievareň"} , $(vSetMaxFinancialYear) >}[Plan of Revenues]),0, RowNo())) . Graph is shown also cumulative values, but I don´t want this. 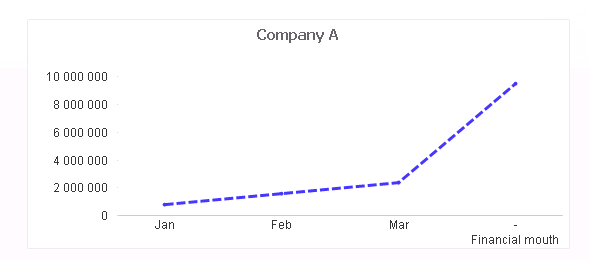
I need only this:
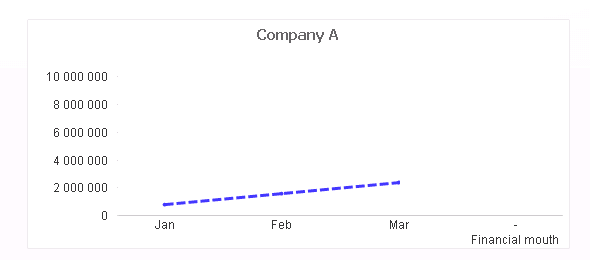
How can I do that ???
Thank you 
Accepted Solutions
- Mark as New
- Bookmark
- Subscribe
- Mute
- Subscribe to RSS Feed
- Permalink
- Report Inappropriate Content
Hi,
tick supress null in dimension tab.
Regards,
Please appreciate our Qlik community members by giving Kudos for sharing their time for your query. If your query is answered, please mark the topic as resolved 🙂
- Mark as New
- Bookmark
- Subscribe
- Mute
- Subscribe to RSS Feed
- Permalink
- Report Inappropriate Content
It works, thank you 
- Mark as New
- Bookmark
- Subscribe
- Mute
- Subscribe to RSS Feed
- Permalink
- Report Inappropriate Content
If you mark the post as helpful the thread is not closed,
so please close this thread by marking the correct answer as the correct one which will be useful for others looking into this thread.
- Mark as New
- Bookmark
- Subscribe
- Mute
- Subscribe to RSS Feed
- Permalink
- Report Inappropriate Content
ok