Unlock a world of possibilities! Login now and discover the exclusive benefits awaiting you.
- Qlik Community
- :
- All Forums
- :
- QlikView App Dev
- :
- Problem with partial sum in pivot table
- Subscribe to RSS Feed
- Mark Topic as New
- Mark Topic as Read
- Float this Topic for Current User
- Bookmark
- Subscribe
- Mute
- Printer Friendly Page
- Mark as New
- Bookmark
- Subscribe
- Mute
- Subscribe to RSS Feed
- Permalink
- Report Inappropriate Content
Problem with partial sum in pivot table
Hi,
I have a question,
I have a data that shown in pivot table with brand dimension, i also has two percentage filter (input box) that user can input with percentage range (from - to).
When i input the range between 80 and 100, each data per brand show correctly, but the total isn't shown, i thought it's because the total has percentage below 80%. When i calculate the total from each data per brand, the total is about x=100 and y =90, and its correct that it must be above 80 %, but why the partial sum is below 80 % ?
sorry if my statement is not too clear, thanks
Really appreciate your help.
- Tags:
- new_to_qlikview
- Mark as New
- Bookmark
- Subscribe
- Mute
- Subscribe to RSS Feed
- Permalink
- Report Inappropriate Content
Try this may be:
=Avg(Aggr(YourExpression, YourChartDimensions))
- Mark as New
- Bookmark
- Subscribe
- Mute
- Subscribe to RSS Feed
- Permalink
- Report Inappropriate Content
This is for additional information,
Percen Filter

When i input percentage between 50 and 100, the data show like this :
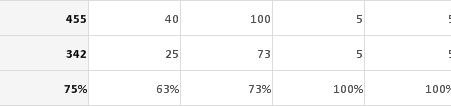
The total is 455,342, and percentage is 75 %
When i input percentage between 70 and 100 the data show like this :
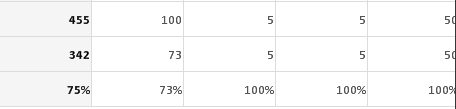
The first column not show, because it is 63% (below 70), but the tota lstill 455, 342, and, 75%. I want to make it flexible, when i input 70 and 100 the total must be 415, 317, 76%.
Do you have any idea ?
Thanks 