Unlock a world of possibilities! Login now and discover the exclusive benefits awaiting you.
- Qlik Community
- :
- All Forums
- :
- QlikView App Dev
- :
- Problem with percentage calculation in Trellis cha...
- Subscribe to RSS Feed
- Mark Topic as New
- Mark Topic as Read
- Float this Topic for Current User
- Bookmark
- Subscribe
- Mute
- Printer Friendly Page
- Mark as New
- Bookmark
- Subscribe
- Mute
- Subscribe to RSS Feed
- Permalink
- Report Inappropriate Content
Problem with percentage calculation in Trellis charts
Hey all
I have a problem with calculation percentage in Trelllis charts.
I want to show the enrollment of Bachelor- and Masterstudents in 8 different Universities in Denmark in a Trellis chart. I have no problem showing the actual number in my first Trellis Chart, but I also want a Trellis Chart where I have calculated the ration (in %)of all Bachelorstudents enrolled in each University divided by all enrolled Bachelorstudents in Total. The data ratio should sum to 100% in each of the Years in the Chart (2007-2013) . Likewise I want the same percentage for Masterstudents in the Chart (called "Kandidat" in Danish).
I use these dimensions/expression:
Dimensions:
- University
- Year
- Type (Bachelor/Master)
Expression:
=sum({$<Status={'Samlet'}, Type={'dkuni, optag'}>} sum) / sum({$<Status={'Samlet'}, Type={'dkuni, optag'}>} TOTAL sum)
Listbox (where I select from Faculties - in the case in the Picture underneath it is "Humaniora" which 6 Universities have)
However my Trellis Charts looks like this:
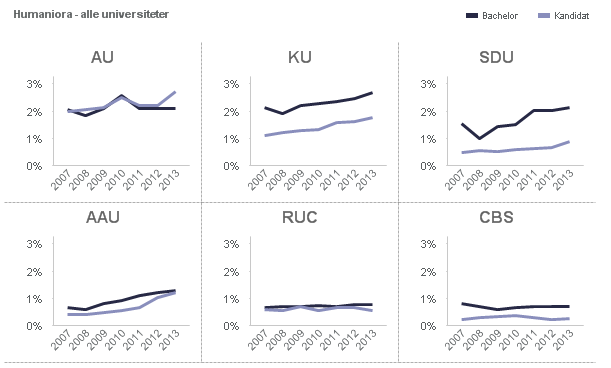
Clearly the percentages are not calculated correctly - what am I doing wrong?
I have attached my data in excel-format
Hope somebody can help - thanx 
Cheers
Bruno
- Tags:
- new_to_qlikview
- « Previous Replies
-
- 1
- 2
- Next Replies »
- Mark as New
- Bookmark
- Subscribe
- Mute
- Subscribe to RSS Feed
- Permalink
- Report Inappropriate Content
By bad - I didn't see Manish answer and thought that there was something called a "Manish Expression" in Qlikview (guess WHO's feeling like a complete fool now )
Thanks a lot both of you - You solved my problem!
Cheers
Bruno
- Mark as New
- Bookmark
- Subscribe
- Mute
- Subscribe to RSS Feed
- Permalink
- Report Inappropriate Content
 My pleasure ...!!
- « Previous Replies
-
- 1
- 2
- Next Replies »