Unlock a world of possibilities! Login now and discover the exclusive benefits awaiting you.
- Qlik Community
- :
- All Forums
- :
- QlikView App Dev
- :
- Problem with set analysis in sum function
- Subscribe to RSS Feed
- Mark Topic as New
- Mark Topic as Read
- Float this Topic for Current User
- Bookmark
- Subscribe
- Mute
- Printer Friendly Page
- Mark as New
- Bookmark
- Subscribe
- Mute
- Subscribe to RSS Feed
- Permalink
- Report Inappropriate Content
Problem with set analysis in sum function
Hi all,
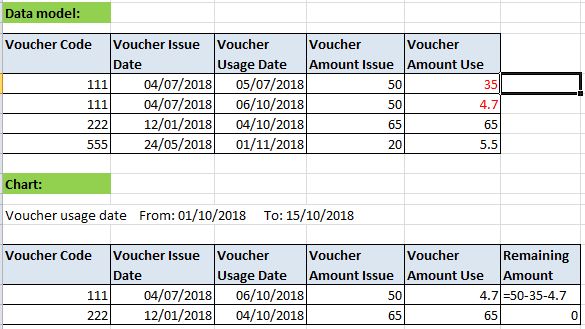
I have a chart which displays a list of vouchers and their usage. KPIs include : issue amount, amount used and remaining amount.
The goal is to display a list of vouchers used within a period of dates. Attached is an image which represents the underlaying data and the chart.
KPI expressions:
Issue amount = sum({<[Usage date]={">=$(v_UsageDateStart) <=$(v_UsageDateEnd)"}>} Issue Amount)
Amount used = sum({<[Usage date]={">=$(v_UsageDateStart) <=$(v_UsageDateEnd)"}>} Amount Used)
Remaining Amount = Issue amount - Amount used
The problem is with the "Amount Used" because it takes into account only usages occuring within the date selection. The client wants that it includes all usages per voucher occuring until the $(v_UsageDateEnd).
I tried using TOTAL in the expression but it's not working (same result as previously)
Amount used = sum(TOTAL<[Voucher Code]> {<[Usage date]={">=$(v_UsageDateStart) <=$(v_UsageDateEnd)"}>} Amount Used)
The following is not working either because it modifies the perimeter of the search :
Amount used = sum({<[Usage date]={"<=$(v_UsageDateEnd)"}>} Amount Used)
I was thinking about Aggr() function but not sure how to implement it.
Thank you in advance for the advice!
- « Previous Replies
-
- 1
- 2
- Next Replies »
- Mark as New
- Bookmark
- Subscribe
- Mute
- Subscribe to RSS Feed
- Permalink
- Report Inappropriate Content
There are two usages:
21/04/2018: usage of 11.80€
03/09/2018: usage of 8.20€
The issue amount is = 20€.
There is only one usage for the period 01/09/2018 - 30/09/2018 : 8.20€
But the total amount used is 20€ (8.20+11.80). So that's why the Remaining value should be = 0.
- Mark as New
- Bookmark
- Subscribe
- Mute
- Subscribe to RSS Feed
- Permalink
- Report Inappropriate Content
How about this...
If(Column(1) <> 0,
RangeSum(
 Sum({<[Usage date] = {">=$(v_UsageDateStart)<=$(v_UsageDateEnd)"}>} [Issue Amount]),
 -Sum(TOTAL <[Voucher Code]> {<[Usage date] = {"<=$(v_UsageDateEnd)"}>} [Amount Used])
))
- Mark as New
- Bookmark
- Subscribe
- Mute
- Subscribe to RSS Feed
- Permalink
- Report Inappropriate Content
Yes, this one worked 🙂 !
Can you explain what is the role of
Column(1)
Thanks a lot for your help !
- Mark as New
- Bookmark
- Subscribe
- Mute
- Subscribe to RSS Feed
- Permalink
- Report Inappropriate Content
I believe we were seeing two rows... -11.80 and 11.80 and you didn't want to see the one with -11.80. So the If statement will remove the one where your issued amount = 0.
- Mark as New
- Bookmark
- Subscribe
- Mute
- Subscribe to RSS Feed
- Permalink
- Report Inappropriate Content
Ok but why two rows ? It's due to the RangeSum function I think but don't know why.
- Mark as New
- Bookmark
- Subscribe
- Mute
- Subscribe to RSS Feed
- Permalink
- Report Inappropriate Content
Because you are using Usage Date as one of the dimensions and for this particular Voucher Code... you have two dimensions for this set analysis
[Usage date] = {"<=$(v_UsageDateEnd)"}So, it shows both :)... I am not sure why do you think it should not show 2 rows? If you remove RangeSum and use this... you don't see two rows (without if and without rangesum)?
Sum({<[Usage date] = {">=$(v_UsageDateStart)<=$(v_UsageDateEnd)"}>} [Issue Amount])
-Sum(TOTAL <[Voucher Code]> {<[Usage date] = {"<=$(v_UsageDateEnd)"}>} [Amount Used])
- Mark as New
- Bookmark
- Subscribe
- Mute
- Subscribe to RSS Feed
- Permalink
- Report Inappropriate Content
You're right, it shows two rows.
Initially, I had the following expression which is showing only one row 🙂
Sum({<[Usage date] = {">=$(v_UsageDateStart)<=$(v_UsageDateEnd)"}>} [Issue Amount])
-Sum({<[Usage date] = {">=$(v_UsageDateStart)<=$(v_UsageDateEnd)"}>} [Amount Used])
Thanks a lot !
- Mark as New
- Bookmark
- Subscribe
- Mute
- Subscribe to RSS Feed
- Permalink
- Report Inappropriate Content
Yes... and you know why? Because Sum({<[Usage date] = {">=$(v_UsageDateStart)<=$(v_UsageDateEnd)"}>} [Amount Used]) was only showing a single Usage date... but this Sum({<[Usage date] = {"<=$(v_UsageDateEnd)"}>} [Amount Used]) shows 2. So, in order to get rid of the row with 0 issue amount... use an if statement. You don't need RangeSum...
- « Previous Replies
-
- 1
- 2
- Next Replies »