Unlock a world of possibilities! Login now and discover the exclusive benefits awaiting you.
- Qlik Community
- :
- All Forums
- :
- QlikView App Dev
- :
- Problems with gaps and sorting in bar chart
- Subscribe to RSS Feed
- Mark Topic as New
- Mark Topic as Read
- Float this Topic for Current User
- Bookmark
- Subscribe
- Mute
- Printer Friendly Page
- Mark as New
- Bookmark
- Subscribe
- Mute
- Subscribe to RSS Feed
- Permalink
- Report Inappropriate Content
Problems with gaps and sorting in bar chart
Hello,
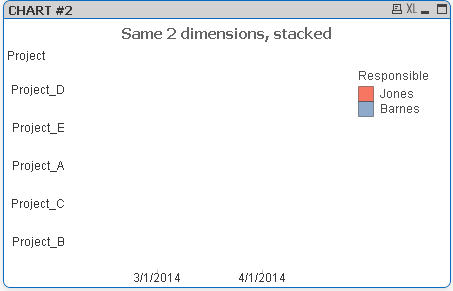
I have a simple table of projects, with the fields Project (unique), Responsible, and EndDate. I am trying to chart these as 2 dimensions and an expression in a horizontal bar chart. The goal is to show a simple timeline from today onwards of which projects each person Responsible has been tasked with. If I group the bars, I get gaps because QV forces a placeholder for all possible values of the 2nd dimension (Responsible) even though there can only ever be 1 value per Project. I tried stacking instead (since there is only 1 2nd dimension value or expression per 1st dimension value anyway) and the chart comes up blank in v10. It does display in v11, but I am restricted to v10 for the forseeable future. Stacking resolves the gap problem in v11 but fails in v10.
The other issue I have is the sort. The customer wants to see the chart sorted by 2nd dimension (Responsible) and then EndDate. I cannot make it work no matter how many options/expressions I have tried.
We all know a picture or chart is worth 1,000 words, so please see the attached file. It has a sample table of data, 2 chart variations I have tried, and a mockup image of what I need the final result to look like. If anyone can provide a solution and explanation I would VERY much appreciate it.
Thanks,
Rich
- Mark as New
- Bookmark
- Subscribe
- Mute
- Subscribe to RSS Feed
- Permalink
- Report Inappropriate Content
pls check 2nd chart...
- Mark as New
- Bookmark
- Subscribe
- Mute
- Subscribe to RSS Feed
- Permalink
- Report Inappropriate Content
Please check enclosed file...
- Mark as New
- Bookmark
- Subscribe
- Mute
- Subscribe to RSS Feed
- Permalink
- Report Inappropriate Content
Thanks for the quick response. I see the desired results in you chart in v11, but when I open the file in v10 there are no bars in it (see attached). I didn't see any v11-specific features