Unlock a world of possibilities! Login now and discover the exclusive benefits awaiting you.
Announcements
Save $650 on Qlik Connect, Dec 1 - 7, our lowest price of the year. Register with code CYBERWEEK: Register
- Qlik Community
- :
- All Forums
- :
- QlikView App Dev
- :
- Process Chart in Qliksense
Options
- Subscribe to RSS Feed
- Mark Topic as New
- Mark Topic as Read
- Float this Topic for Current User
- Bookmark
- Subscribe
- Mute
- Printer Friendly Page
Turn on suggestions
Auto-suggest helps you quickly narrow down your search results by suggesting possible matches as you type.
Showing results for
Not applicable
2017-01-13
04:24 AM
- Mark as New
- Bookmark
- Subscribe
- Mute
- Subscribe to RSS Feed
- Permalink
- Report Inappropriate Content
Process Chart in Qliksense
Hello all,
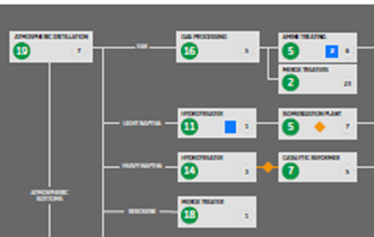
Is it possible to create a process chart kind of visualization in Qliksense.
Is there any such extension object available?
Something like attached.
805 Views
3 Replies
Master III
2017-01-13
04:41 AM
- Mark as New
- Bookmark
- Subscribe
- Mute
- Subscribe to RSS Feed
- Permalink
- Report Inappropriate Content
684 Views
Not applicable
2017-01-13
05:40 AM
Author
- Mark as New
- Bookmark
- Subscribe
- Mute
- Subscribe to RSS Feed
- Permalink
- Report Inappropriate Content
But robert, if we use this particular tool, can we integrate with Qliksense.
Also like number 19 (in green circles) are all metrics .
Blue rectangle are like status. which will change as per values.
684 Views
Master III
2017-01-13
05:49 AM
- Mark as New
- Bookmark
- Subscribe
- Mute
- Subscribe to RSS Feed
- Permalink
- Report Inappropriate Content
So in this case I would use mashups
It will give you more control in front end and with HTML.CSS you can create whatever you need.
684 Views