Unlock a world of possibilities! Login now and discover the exclusive benefits awaiting you.
- Qlik Community
- :
- All Forums
- :
- QlikView App Dev
- :
- Products on columns instead of rows
- Subscribe to RSS Feed
- Mark Topic as New
- Mark Topic as Read
- Float this Topic for Current User
- Bookmark
- Subscribe
- Mute
- Printer Friendly Page
- Mark as New
- Bookmark
- Subscribe
- Mute
- Subscribe to RSS Feed
- Permalink
- Report Inappropriate Content
Products on columns instead of rows
Hi
I have a table with with the following layout:
2011-01-01, ProduktA, Revenue
2011-01-02, ProduktB, Revenue
2011-01-03, ProduktC, Revenue
But I would like to have the products on columns instead (dynamicly)
2011-01-01, ProductA, ProductB, ProductC
2011-01-02, ProductA, ProductB, ProductC
2011-01-02, ProductA, ProductB, ProductC
How can I do this dynamicly (if I add products they will be adding on the right.)
Regards mikael
- Tags:
- qlikview_scripting
- Mark as New
- Bookmark
- Subscribe
- Mute
- Subscribe to RSS Feed
- Permalink
- Report Inappropriate Content
Hi Mikael ,
Use Cross table function o second option is you can use transform option while loading data into the Qlikview.
Thanks,
AS
- Mark as New
- Bookmark
- Subscribe
- Mute
- Subscribe to RSS Feed
- Permalink
- Report Inappropriate Content
Hi mikael,
You can select Product column and drag it to horizontal row. You will get similar result as below:
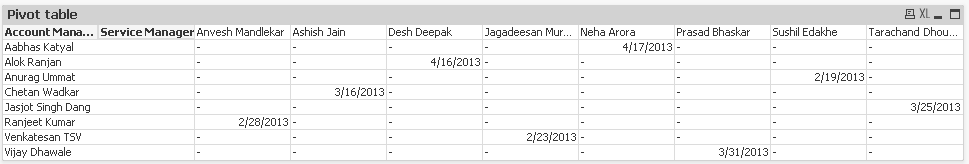
I hope this is what you are desired to achieve!
Regards,
Neha
- Mark as New
- Bookmark
- Subscribe
- Mute
- Subscribe to RSS Feed
- Permalink
- Report Inappropriate Content
Hi, do you have examples for a transformation ?
- Mark as New
- Bookmark
- Subscribe
- Mute
- Subscribe to RSS Feed
- Permalink
- Report Inappropriate Content
Hi, I need to to this in the script. regards mikael
- Mark as New
- Bookmark
- Subscribe
- Mute
- Subscribe to RSS Feed
- Permalink
- Report Inappropriate Content
Hi Check with the Generic Load option
Please Check the below document link for the usage
- Mark as New
- Bookmark
- Subscribe
- Mute
- Subscribe to RSS Feed
- Permalink
- Report Inappropriate Content
CrossTable (ProductColumn, Data,3) LOAD [Date], [Product Name] FROM Data.xlsx
here ProductColumn is attribute Field name ,Data which contains data like revenue 3 insense no of qulifiers
Or try these dynamically
T2:
load RowNo() as id, * inline [
Date, Produkt
2011-01-01, ProduktA
2011-01-02,ProduktB
2011-01-03,ProduktC
];
T3:
load RowNo() as id, Produktas as ProductA
Resident T2 where Name = 'ProductA';
join(T3)
load RowNo() as id, Produktas as ProduktB
Resident T2 where Name = 'ProduktB';
join(T3)
load RowNo() as id, Produktas as ProduktC
Resident T2 where Name = 'ProduktC';
drop field id;
drop table T2;
You can replace the inline load with a load statements that load your Table 1 data.
- Mark as New
- Bookmark
- Subscribe
- Mute
- Subscribe to RSS Feed
- Permalink
- Report Inappropriate Content
Hi Mikael,
A cross table is a common type of table featuring a matrix of values between two orthogonal lists of header data. It could look like the table below:
Example:
- a.csv
Year | Jan | Feb | Mar | Apr | May |
1991 | 45 | 65 | 78 | 12 | 78 |
1992 | 11 | 23 | 22 | 22 | 45 |
1993 | 65 | 56 | 22 | 79 | 12 |
1994 | 65 | 24 | 32 | 78 | 55 |
1995 | 45 | 56 | 35 | 78 | 68 |
If this table is simply loaded into QlikView, the result will be one field for Year and one field for each of the months. This is generally not what you would like to have. One would probably prefer to have three fields generated, one for each header category (Year and Month) and one for the data values inside the matrix.
This can be achieved by adding the crosstable prefix to your load or select statement.The statement for loading this cross table could be:
crosstable (Month, Sales) load * from a.csv;
The result in QlikView would be as follows:
Year | Month | Sales |
1991 | Jan | 45 |
1992 | Feb | 11 |
1993 | Mar | 65 |
1994 | Apr | 65 |
1995 | May | 65 |
23 | ||
56 | ||
24 |
- Mark as New
- Bookmark
- Subscribe
- Mute
- Subscribe to RSS Feed
- Permalink
- Report Inappropriate Content
Hi Miael,
Are you looking for this one
[Source]:
LOAD * Inline [
Dates   ,Product,Revenue
2011-01-01, ProduktA, Revenue
2011-01-02, ProduktB, Revenue
2011-01-03, ProduktC, Revenue];


[TMP1]:
GENERIC LOAD * RESIDENT [Source];


[Result1]:
LOAD DISTINCT Dates RESIDENT [Source];

DROP TABLE [Source];


FOR i = 0 to NoOfTables()
TableList:
LOAD TableName($(i)) AS TableName AutoGenerate 1
WHERE WildMatch(TableName($(i)), 'TMP1.*');
NEXT i

FOR i = 1 to FieldValueCount('TableName')
LET vTable = FieldValue('TableName', $(i));
LEFT JOIN ([Result1]) LOAD * RESIDENT $(vTable);
DROP TABLE $(vTable);
NEXT i

DROP Table TableList;
Regards,
Sokkorn