Unlock a world of possibilities! Login now and discover the exclusive benefits awaiting you.
- Qlik Community
- :
- All Forums
- :
- QlikView App Dev
- :
- Qlikview 11 for developers - Pie chart formatting
- Subscribe to RSS Feed
- Mark Topic as New
- Mark Topic as Read
- Float this Topic for Current User
- Bookmark
- Subscribe
- Mute
- Printer Friendly Page
- Mark as New
- Bookmark
- Subscribe
- Mute
- Subscribe to RSS Feed
- Permalink
- Report Inappropriate Content
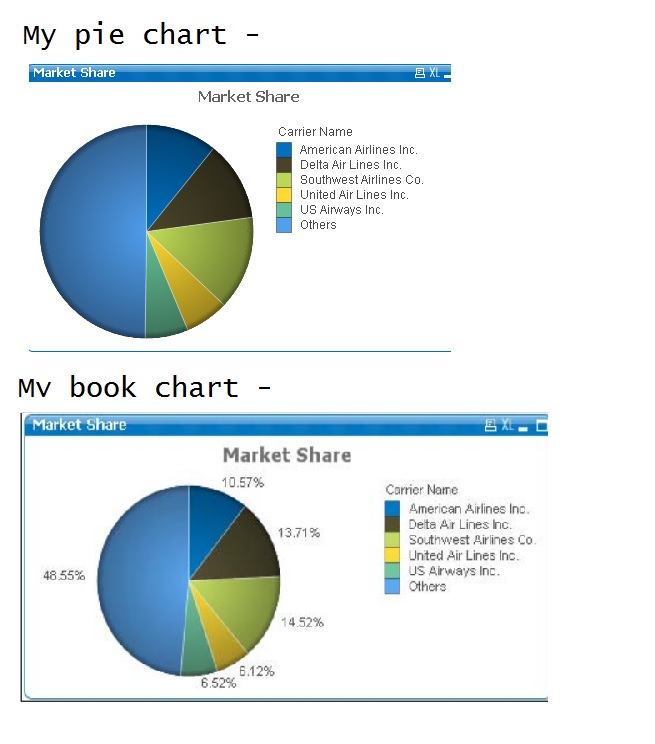
Qlikview 11 for developers - Pie chart formatting
How do I add the percentages ?

- « Previous Replies
-
- 1
- 2
- Next Replies »
- Mark as New
- Bookmark
- Subscribe
- Mute
- Subscribe to RSS Feed
- Permalink
- Report Inappropriate Content
This has actually changed in later versions of QlikView (we wrote against QV11 SR1) and doesn't work anymore. Will follow up with the correct solution later.
- Mark as New
- Bookmark
- Subscribe
- Mute
- Subscribe to RSS Feed
- Permalink
- Report Inappropriate Content
Dear John,
There is a known bug that was found in some version of
Qlikview (example version11.20SR3). In 11.20SR3, % on Pie chart is not
displayed. This was corrected from QlikView desktop v 11.20SR4. If you are
using such version you will need to update to latest version ex 11.20SR5 to be
able to view % in Pie chart.
/jo
- Mark as New
- Bookmark
- Subscribe
- Mute
- Subscribe to RSS Feed
- Permalink
- Report Inappropriate Content
Hi,
I've got some expression that works the same as Relative option, but it gives you more flexibility to add some additional characters and much more to your expression on a chart:
=num( (sum [Your_Measure])*100 / sum(TOTAL [Your_Measure]) ), '#.##0,00' ) & ' %'
1) num function lets you format the number
2) TOTAL lets you sum across all your dimensions up (not only one dimension)
3) & joins different types of data (here: numbers and string)
4) ' %' simply adds % in the end of you calculation
I know it's really simple, but sometimes when you begin (as me) with QV it might be helpful.
Best regards,
Michał
- Mark as New
- Bookmark
- Subscribe
- Mute
- Subscribe to RSS Feed
- Permalink
- Report Inappropriate Content
Better: Make the percentage part of the format ![]() :
:
=num( (sum [Your_Measure]) / sum(TOTAL [Your_Measure]) ), '#.##0,00%' )
Anyway,
Why are we kicking a 1 year old topic?
- « Previous Replies
-
- 1
- 2
- Next Replies »