Unlock a world of possibilities! Login now and discover the exclusive benefits awaiting you.
- Qlik Community
- :
- All Forums
- :
- QlikView App Dev
- :
- Qlikview 11 sample question
Options
- Subscribe to RSS Feed
- Mark Topic as New
- Mark Topic as Read
- Float this Topic for Current User
- Bookmark
- Subscribe
- Mute
- Printer Friendly Page
Turn on suggestions
Auto-suggest helps you quickly narrow down your search results by suggesting possible matches as you type.
Showing results for
Not applicable
2014-03-25
05:50 PM
- Mark as New
- Bookmark
- Subscribe
- Mute
- Subscribe to RSS Feed
- Permalink
- Report Inappropriate Content
Qlikview 11 sample question
Hi, I will be posting a series of sample questions for qlikview. Please help me to get the answers.
Thanks.
This is the first one.
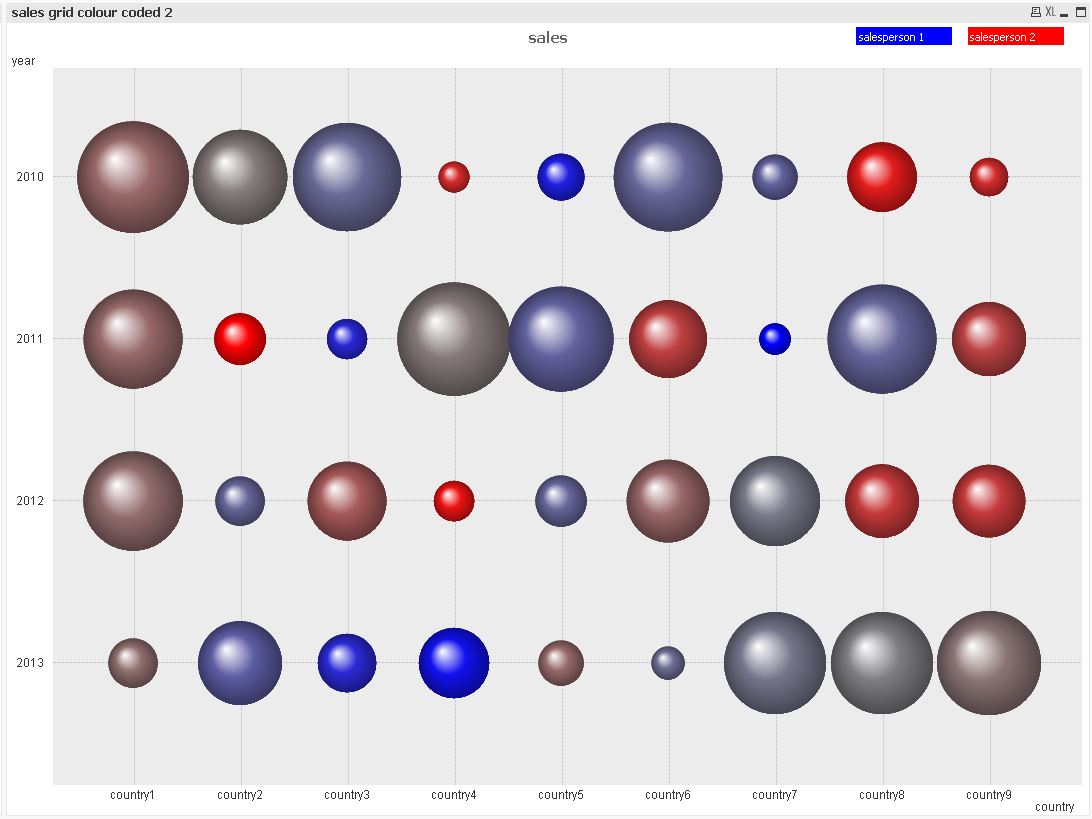
A customer needs to compare sales results for nine countries over four years for two salespersons. Which Trellis Chart by country should a designer use?
Bar Charts by year by salesperson with grouped style
Pie Charts by year by salesperson with 3D style
Line Charts by year by salesperson with stacked, 3D style
Block Charts by year by salesperson with stacked style
- Tags:
- new_to_qlikview
1,161 Views
- « Previous Replies
-
- 1
- 2
- Next Replies »
10 Replies
MVP
2014-03-25
08:50 PM
- Mark as New
- Bookmark
- Subscribe
- Mute
- Subscribe to RSS Feed
- Permalink
- Report Inappropriate Content
another chart that better distincts between the different salespersons:
- « Previous Replies
-
- 1
- 2
- Next Replies »