Unlock a world of possibilities! Login now and discover the exclusive benefits awaiting you.
- Qlik Community
- :
- All Forums
- :
- QlikView App Dev
- :
- Re: Qlikview Histogram with Multiple Dimensions Va...
- Subscribe to RSS Feed
- Mark Topic as New
- Mark Topic as Read
- Float this Topic for Current User
- Bookmark
- Subscribe
- Mute
- Printer Friendly Page
- Mark as New
- Bookmark
- Subscribe
- Mute
- Subscribe to RSS Feed
- Permalink
- Report Inappropriate Content
Qlikview Histogram with Multiple Dimensions Values
Dear Team,
We are getting Handset Model wise RSCP ranges in a day where with distribution of -5DB as header and its correpsonfing count values.
With this multiple columns for RSCP how can we show Histogram per range of rscp.
Sample data looks like as below:
| Model | -115 | -110 | -105 | -100 | -95 | -90 | -85 | -80 | -75 | -70 | -65 | -60 | -55 | -50 | -45 | -40 | -35 | -30 |
| Motorola-Motorola Moto G 2nd Gen | 34 | 22 | 38 | 50 | 127 | 605 | 893 | 2183 | 2631 | 1598 | 1139 | 658 | 281 | 33 | 2 | |||
| Samsung-Samsung Galaxy Grand 2 | 3 | 1 | 1 | 22 | 125 | 444 | 1009 | 2178 | 1840 | 1164 | 732 | 1261 | 551 | 116 | 2 | |||
| Microsoft-Microsoft Lumia 535 | 3 | 10 | 20 | 235 | 741 | 1785 | 1633 | 1405 | 863 | 761 | 941 | 670 | 248 | 83 | 16 | 1 |
How to achieve different range value sin X AXES for multiple value like as above.
Output in Bar chart or Line charr as below for different Models.
Can you please advise and prvide your valuable inputs to achive Hisotgrams charts?
Sample data attached.
Accepted Solutions
- Mark as New
- Bookmark
- Subscribe
- Mute
- Subscribe to RSS Feed
- Permalink
- Report Inappropriate Content
Use a CROSSTABLE LOAD prefix to transform your input:
SET ThousandSep=',';
SET DecimalSep='.';

INPUT:
CrossTable(RSCP, Count)
LOAD Model,
    [-115.000000],
    [-110.000000],
    [-105.000000],
    [-100.000000],
    [-95.000000],
    [-90.000000],
    [-85.000000],
    [-80.000000],
    [-75.000000],
    [-70.000000],
    [-65.000000],
    [-60.000000],
    [-55.000000],
    [-50.000000],
    [-45.000000],
    [-40.000000],
    [-35.000000],
    [-30.000000]
FROM

(ooxml, embedded labels, table is [RSCP Distribution], filters(
Remove(Col, Pos(Top, 20))
));


FACTS:
NoConcatenate
LOAD Model, Round(Num#(RSCP)) as RSCP, Count
Resident INPUT;


DROP TABLE INPUT;
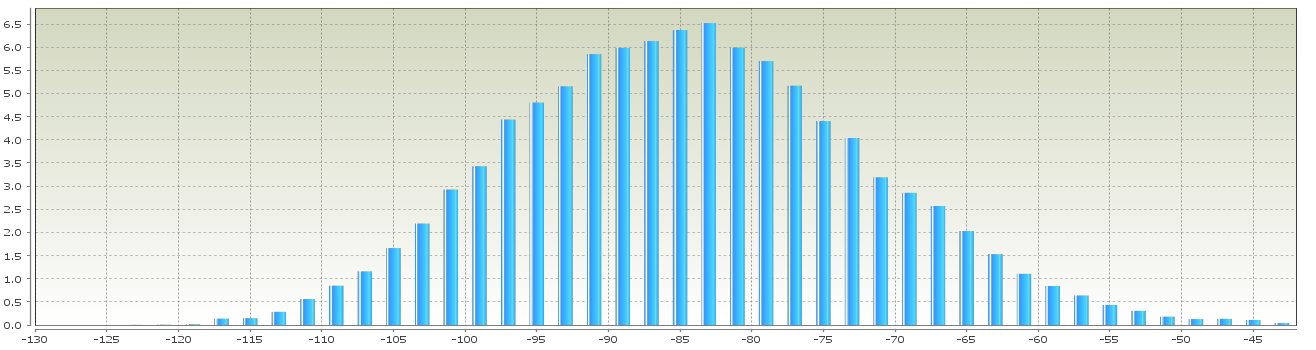
Then create a line chart with dimensions Model and RSCP and Sum(Count) as expression:
![2017-06-14 12_26_44-Device Experience Sheet_RSCP Distribution.xlsx [Geschützte Ansicht] - Excel.png](/legacyfs/online/166828_2017-06-14 12_26_44-Device Experience Sheet_RSCP Distribution.xlsx [Geschützte Ansicht] - Excel.png)
- Mark as New
- Bookmark
- Subscribe
- Mute
- Subscribe to RSS Feed
- Permalink
- Report Inappropriate Content
Use a CROSSTABLE LOAD prefix to transform your input:
SET ThousandSep=',';
SET DecimalSep='.';

INPUT:
CrossTable(RSCP, Count)
LOAD Model,
    [-115.000000],
    [-110.000000],
    [-105.000000],
    [-100.000000],
    [-95.000000],
    [-90.000000],
    [-85.000000],
    [-80.000000],
    [-75.000000],
    [-70.000000],
    [-65.000000],
    [-60.000000],
    [-55.000000],
    [-50.000000],
    [-45.000000],
    [-40.000000],
    [-35.000000],
    [-30.000000]
FROM

(ooxml, embedded labels, table is [RSCP Distribution], filters(
Remove(Col, Pos(Top, 20))
));


FACTS:
NoConcatenate
LOAD Model, Round(Num#(RSCP)) as RSCP, Count
Resident INPUT;


DROP TABLE INPUT;
Then create a line chart with dimensions Model and RSCP and Sum(Count) as expression:
- Mark as New
- Bookmark
- Subscribe
- Mute
- Subscribe to RSS Feed
- Permalink
- Report Inappropriate Content
Hi Stefan,
Thanks a lot for your quick advise on this .
Get to know from this how Crossable works perfect in such scenarios.
- Mark as New
- Bookmark
- Subscribe
- Mute
- Subscribe to RSS Feed
- Permalink
- Report Inappropriate Content
Dear Stefan,
Can you please advise on the below after using the Crosstable.?
What we need is to calculate Percent contribution of each model base don threshold set by user in Straight table or Pivot table
For example if user sets Thresold =-95dbm then we need to calculate (sum of all columns values <=-95)/D_RSCP /
Threshold is set by user base don the column header that we have .(-130 to >-25DB).
As shown below Average= X_RSCP/D_RSCP .
But Percent= (sum of all columns values <=-95)/D_RSCP)
So here for Asus Model it result shown as =4/4865.
I am not able to identify how to get the dynamic sum of coulmns below the threshold set ie( <=-130 + <=-125..... +<=-95) at run time.
I was trying with RANGESUM but could not suuceed in getting the below result.
Can you pleas eprovide your vaualbe imputs here.
Sample data provided with Output.
| Unit: Count, Sort By: Average, Threshold = -95 | |||||||||||||||||||||||||||
| Model | Percent | Average | X_Rscp | D_Rscp | <=-130 | <=-125 | <=-120 | <=-115 | <=-110 | <=-105 | <=-100 | <=-95 | <=-90 | <=-85 | <=-80 | <=-75 | <=-70 | <=-65 | <=-60 | <=-55 | <=-50 | <=-45 | <=-40 | <=-35 | <=-30 | <=-25 | >-25 |
| Asus-Asus Zenfone 5 | 0.08 | -82.97 | -403665 | 4865 | 0 | 0 | 0 | 0 | 0 | 0 | 0 | 4 | 136 | 649 | 2004 | 1582 | 293 | 117 | 29 | 36 | 15 | 0 | 0 | 0 | 0 | 0 | 0 |
| Microsoft-Microsoft Mobile Lumia 640 XL Dual SIM/RM-1067 | 0.07 | -80.61 | -217815 | 2702 | 0 | 0 | 0 | 0 | 0 | 0 | 0 | 2 | 17 | 245 | 745 | 979 | 514 | 160 | 33 | 6 | 0 | 1 | 0 | 0 | 0 | 0 | 0 |
| Samsung-Samsung Galaxy E7 | 0.05 | -79.81 | -335295 | 4201 | 0 | 0 | 0 | 0 | 0 | 0 | 0 | 2 | 58 | 420 | 1122 | 1415 | 364 | 537 | 271 | 10 | 2 | 0 | 0 | 0 | 0 | 0 | 0 |
| Xiaomi Corporation-Xiaomi 2014818/H2X LTE/Xiaomi Redmi 2 LTE | 1.38 | -79.13 | -356385 | 4504 | 0 | 0 | 0 | 0 | 1 | 1 | 7 | 53 | 351 | 750 | 586 | 722 | 772 | 615 | 412 | 222 | 12 | 0 | 0 | 0 | 0 | 0 | 0 |
- Mark as New
- Bookmark
- Subscribe
- Mute
- Subscribe to RSS Feed
- Permalink
- Report Inappropriate Content
Different methods possible, all start with a CROSSTABLE transformation of your facts.
Then either filter your RSCP column using set analysis or alternatively, use a AsOf table approach:
Calculating rolling n-period totals, averages or other aggregations
![2017-06-20 16_48_55-QlikView x64 - [C__Users_Stefan_Downloads_comm264005_b.qvw].png](/legacyfs/online/167495_2017-06-20 16_48_55-QlikView x64 - [C__Users_Stefan_Downloads_comm264005_b.qvw].png)
![2017-06-20 16_49_09-QlikView x64 - [C__Users_Stefan_Downloads_comm264005_b.qvw].png](/legacyfs/online/167496_2017-06-20 16_49_09-QlikView x64 - [C__Users_Stefan_Downloads_comm264005_b.qvw].png)
- Mark as New
- Bookmark
- Subscribe
- Mute
- Subscribe to RSS Feed
- Permalink
- Report Inappropriate Content
Dear Stefan,
Thanks. I looked at the table ,but the difference from the output is that the Percent column should be available along with all RSCP COLUMNS as shown in above examples .
If I add here RSCP_DIM as another dimension in the qvw file that you attached , all values gets changed.
Table structure output is as below:
Can you please advise here ?
| Model | Percent | Average | X_Rscp | D_Rscp | <=-130 | <=-125 | <=-120 | <=-115 | <=-110 | <=-105 | <=-100 | <=-95 | <=-90 | <=-85 | <=-80 | <=-75 | <=-70 | <=-65 | <=-60 | <=-55 | <=-50 | <=-45 | <=-40 | <=-35 | <=-30 | <=-25 | >-25 |
| Asus-Asus Zenfone 5 | 0.08 | -82.97 | -403665 | 4865 | 0 | 0 | 0 | 0 | 0 | 0 | 0 | 4 | 136 | 649 | 2004 | 1582 | 293 | 117 | 29 | 36 | 15 | 0 | 0 | 0 | 0 | 0 | 0 |
| Microsoft-Microsoft Mobile Lumia 640 XL Dual SIM/RM-1067 | 0.07 | -80.61 | -217815 | 2702 | 0 | 0 | 0 | 0 | 0 | 0 | 0 | 2 | 17 | 245 | 745 | 979 | 514 | 160 | 33 | 6 | 0 | 1 | 0 | 0 | 0 | 0 | 0 |
| Samsung-Samsung Galaxy E7 | 0.05 | -79.81 | -335295 | 4201 | 0 | 0 | 0 | 0 | 0 | 0 | 0 | 2 | 58 | 420 | 1122 | 1415 | 364 | 537 | 271 | 10 | 2 | 0 | 0 | 0 | 0 | 0 | 0 |
| Xiaomi Corporation-Xiaomi 2014818/H2X LTE/Xiaomi Redmi 2 LTE | 1.38 | -79.13 | -356385 | 4504 | 0 | 0 | 0 |