Unlock a world of possibilities! Login now and discover the exclusive benefits awaiting you.
- Qlik Community
- :
- All Forums
- :
- QlikView App Dev
- :
- Quartile metric calculation using set analysis
- Subscribe to RSS Feed
- Mark Topic as New
- Mark Topic as Read
- Float this Topic for Current User
- Bookmark
- Subscribe
- Mute
- Printer Friendly Page
- Mark as New
- Bookmark
- Subscribe
- Mute
- Subscribe to RSS Feed
- Permalink
- Report Inappropriate Content
Quartile metric calculation using set analysis
Hi All,
I need to create a pivot table by grouping the metric (sales) into 4 groups (Quartiles).
Q1 - Sum of all sales where Sales > (Max(Sales)*0.75)
Q2 - Sum of all sales where Sales >= (Max(Sales)*0.5) and Sales < (Max(Sales)*0.75)
Q3 - Sum of all sales where Sales >= (Max(Sales)*0.25) and Sales < (Max(Sales)*0.5)
Q4 - Sum of all sales where Sales < (Max(Sales)*0.25)
e.g: For NAM and Dir combination Max(Sales) is 15 and Max(Sales)*0.75 is 11.25
Q1= 15+12 =27
Q2= 10
Q3=0
Q4=0
Data set
| Region | Title | Employee | Sales |
| NAM | Dir | E1 | 10 |
| NAM | Dir | E2 | 15 |
| NAM | Dir | E3 | 12 |
| NAM | VP | E4 | 16 |
| NAM | VP | E5 | 13 |
| NAM | VP | E6 | 10 |
| NAM | VP | E7 | 2 |
| ASIA | VP | E8 | 10 |
| ASIA | VP | E9 | 5 |
| ASIA | VP | E10 | 1 |
Expected Output:
| Region | Title | Q1 | Q2 | Q3 | Q4 |
| NAM | Dir | 27 | 10 | 0 | 0 |
| NAM | VP | 29 | 10 | 0 | 2 |
| ASIA | VP | 10 | 5 | 0 | 1 |
I tried below expression but does not produce correct results.
Q1= sum ({$<Sales={'>= $(#=max(Sales)*0.75)'}>}Sales)
Q2= sum ({$<Sales={'< $(#=max(Sales)*0.75) >= $(#=max(Sales)*0.5) '}>}Sales)
Q3= sum ({$<Sales={'< $(#=max(Sales)*0.5) >= $(#=max(Sales)*0.25) '}>}Sales)
Q4= sum ({$<Sales={'< $(#=max(Sales)*0.25)'}>}Sales)
Please advice.
- « Previous Replies
-
- 1
- 2
- Next Replies »
Accepted Solutions
- Mark as New
- Bookmark
- Subscribe
- Mute
- Subscribe to RSS Feed
- Permalink
- Report Inappropriate Content
Try the following expressions:
Q1:
Sum(Aggr(If(Sum(Sales) >= Max(TOTAL <Title,Region> Sales) * 0.75,Sum(Sales)),Region,Title,Employee))
Q2:
Sum(Aggr(If(Sum(Sales) >= Max(TOTAL <Title,Region> Sales) * 0.5 And Sum(Sales) < Max(TOTAL <Title,Region> Sales) * 0.75,Sum(Sales)),Region,Title,Employee))
Q3 and Q4 same as these with the factors changed. This gives the output your after.
It is also customisable so that if your dimensions changes, you can modify the functions to reflect in the appropriate places.
If you introduce other dimensions particularly if they reduce the lowest level below employee may need to play with the functions a little.
- Mark as New
- Bookmark
- Subscribe
- Mute
- Subscribe to RSS Feed
- Permalink
- Report Inappropriate Content
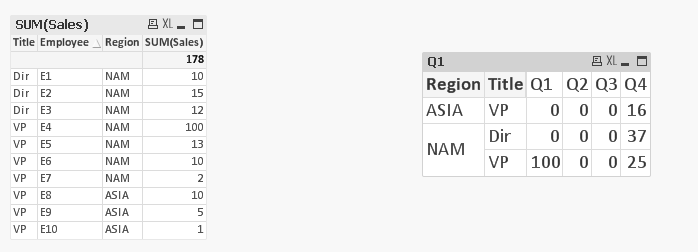
Please check enclosed file.
My output is slightly different...
Let me know whether it works f
- Mark as New
- Bookmark
- Subscribe
- Mute
- Subscribe to RSS Feed
- Permalink
- Report Inappropriate Content
Hi,
I don't think you can use set analysis for this because the set analysis condition is only calculated once for the whole dataset, not per dimension. This means that Max(Sales) inside a set analysis will get the max (=16) for the whole dataset.
You may need to calculate those max values beforehand in the script.
-Teemu
- Mark as New
- Bookmark
- Subscribe
- Mute
- Subscribe to RSS Feed
- Permalink
- Report Inappropriate Content
Teemu,
Thanks for replying. Is there any other way to achieve this e.g. aggr(), fractlie()?
- Mark as New
- Bookmark
- Subscribe
- Mute
- Subscribe to RSS Feed
- Permalink
- Report Inappropriate Content
Hi Manish,
appreciate your help. But the xpressions does not appear to work for the reason Teemu has mentioned. I changed the input numbers slightly and reloaded qvw. Check the output. They are wrong.
- Mark as New
- Bookmark
- Subscribe
- Mute
- Subscribe to RSS Feed
- Permalink
- Report Inappropriate Content
Hi,
You may be able to use some sort of If statement with aggr etc. but I'm not sure. And personally I hate If statements because they can be very slow. If the row count is not an issue I would probably calculate those dimension specific max values in the script. It would make the expressions a bit simpler too I think.
Sorry but I can't provide you with an example at this time. I'll see if I have time later today.
-Teemu
- Mark as New
- Bookmark
- Subscribe
- Mute
- Subscribe to RSS Feed
- Permalink
- Report Inappropriate Content
I agree with Teemu, It is efficient to do it in Script.
Other dirty way is to create Variables, But you will end up with 4 * 5 * 3 variables
Assuming 4 regions, 5 Titles and 3 Quartiles. Use those variables in the expression.
It is interesting to know if some one solves this. 
- Mark as New
- Bookmark
- Subscribe
- Mute
- Subscribe to RSS Feed
- Permalink
- Report Inappropriate Content
Sudheer, Teemu,
Script may not be an option as I have 30 other dimensions that can change the combination. For e.g. Month, Year, Dept, Region etc. User can make selection on any of these dimensions and calculation needs to reflect the selections.
I shared a simplified data set for illustrating the problem.
- Mark as New
- Bookmark
- Subscribe
- Mute
- Subscribe to RSS Feed
- Permalink
- Report Inappropriate Content
Try the following expressions:
Q1:
Sum(Aggr(If(Sum(Sales) >= Max(TOTAL <Title,Region> Sales) * 0.75,Sum(Sales)),Region,Title,Employee))
Q2:
Sum(Aggr(If(Sum(Sales) >= Max(TOTAL <Title,Region> Sales) * 0.5 And Sum(Sales) < Max(TOTAL <Title,Region> Sales) * 0.75,Sum(Sales)),Region,Title,Employee))
Q3 and Q4 same as these with the factors changed. This gives the output your after.
It is also customisable so that if your dimensions changes, you can modify the functions to reflect in the appropriate places.
If you introduce other dimensions particularly if they reduce the lowest level below employee may need to play with the functions a little.
- Mark as New
- Bookmark
- Subscribe
- Mute
- Subscribe to RSS Feed
- Permalink
- Report Inappropriate Content
Bingo!! that works perfectly!
Thanks Michael.
- « Previous Replies
-
- 1
- 2
- Next Replies »