Unlock a world of possibilities! Login now and discover the exclusive benefits awaiting you.
- Qlik Community
- :
- All Forums
- :
- QlikView
- :
- Question about Stacked Waterfall chart
- Subscribe to RSS Feed
- Mark Topic as New
- Mark Topic as Read
- Float this Topic for Current User
- Bookmark
- Subscribe
- Mute
- Printer Friendly Page
- Mark as New
- Bookmark
- Subscribe
- Mute
- Subscribe to RSS Feed
- Permalink
- Report Inappropriate Content
Question about Stacked Waterfall chart
Hey everyone,
Using the tips from other discussions/questions, I am attempting to put together a waterfall chart.
Having some trouble getting the "offset" columns to stick together -- as in the various dimensions making up the stacked column appear to disconnect (Image 1). Also -- wondering how to get the dollar amount labels broken out as 3 individual labels per column (Parts, Mods, Total).
Image 1:
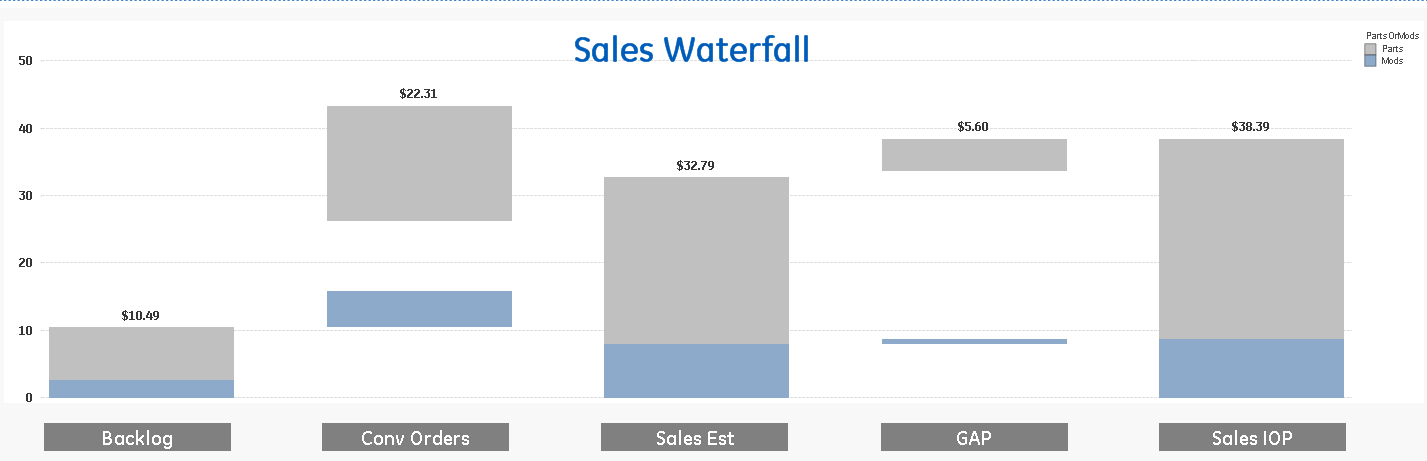
My desired result is a chart that looks similar to the one below.
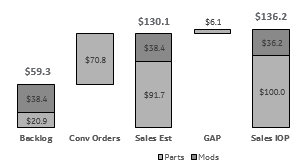
Thanks in advance for the help!!!
Accepted Solutions
- Mark as New
- Bookmark
- Subscribe
- Mute
- Subscribe to RSS Feed
- Permalink
- Report Inappropriate Content
Hello, Brian!
My apologize for delay with answer!
I've created a classic waterfall chart on your model. It means that for each next bar offset depends on previous bar value (there is no bars at the middle of the chart with hardcoded offset 0).
In that approach you may see that the last bar is not reaching the zero (for 1 quarter it is, but for the second it's not).
If you want to tie some bar to zero value - just comment the calculation offset in the first expression for wanted bar.
PFA.
P.S.: I've let myself to turn your table view into a camomile 😃
- Mark as New
- Bookmark
- Subscribe
- Mute
- Subscribe to RSS Feed
- Permalink
- Report Inappropriate Content
Hello, Brian!
Your project is great!
In case of creating a waterfall chart (with total sums) it may be a tough task without some aggregation steps.
I'm offering you to aggregate your tables and change a chart construction methods.
If it's possible, then you may find some usefull things in the attached file.
(There is a chart on aggregated values. And we a lucky that total sums are regarded for those values which don't have an offset. Otherwise "Show Value" wouldn't make a sense)
- Mark as New
- Bookmark
- Subscribe
- Mute
- Subscribe to RSS Feed
- Permalink
- Report Inappropriate Content
Hey Sergey,
Thank you for your helpful post!
Just looked at your .qvw, and the waterfalls look great.
Like you, I am thinking that my table structure is making it hard to create waterfalls. Specifically, the multiple cross-table loads joined on multiple synthetic keys. Not sure what the best solution would be (concat/type of join?) -- but would definitely be open to changing the table structure and chart methods.
Looking forward to hearing your insight!
Thanks,
Brian
- Mark as New
- Bookmark
- Subscribe
- Mute
- Subscribe to RSS Feed
- Permalink
- Report Inappropriate Content
Also -- noticed that for the "orders" field -- you had 0 hardcoded in for one of the categories (parts/mods). When I changed it to a positive integer --- it threw the chart off a bit. Any idea on how to fix this?
- Mark as New
- Bookmark
- Subscribe
- Mute
- Subscribe to RSS Feed
- Permalink
- Report Inappropriate Content
Hello, Brian!
My apologize for delay with answer!
I've created a classic waterfall chart on your model. It means that for each next bar offset depends on previous bar value (there is no bars at the middle of the chart with hardcoded offset 0).
In that approach you may see that the last bar is not reaching the zero (for 1 quarter it is, but for the second it's not).
If you want to tie some bar to zero value - just comment the calculation offset in the first expression for wanted bar.
PFA.
P.S.: I've let myself to turn your table view into a camomile 😃
- Mark as New
- Bookmark
- Subscribe
- Mute
- Subscribe to RSS Feed
- Permalink
- Report Inappropriate Content
Hey Sergey,
Thank you very much! I apologize for the double post about making the stacked columns stick together for each dimension. Will go through both answers (yours for this question, and the answer to my other post) and attempt to learn what both of you did. Thanks again, this is great!
-Brian
P.S. Your chamomile looks great 