Unlock a world of possibilities! Login now and discover the exclusive benefits awaiting you.
- Qlik Community
- :
- All Forums
- :
- QlikView App Dev
- :
- Radar Chart - Help!
Options
- Subscribe to RSS Feed
- Mark Topic as New
- Mark Topic as Read
- Float this Topic for Current User
- Bookmark
- Subscribe
- Mute
- Printer Friendly Page
Turn on suggestions
Auto-suggest helps you quickly narrow down your search results by suggesting possible matches as you type.
Showing results for
Not applicable
2013-10-15
11:50 AM
- Mark as New
- Bookmark
- Subscribe
- Mute
- Subscribe to RSS Feed
- Permalink
- Report Inappropriate Content
Radar Chart - Help!
Hi
Trying to create a Radar Chart from the following data:
| Candidate | Importance A | Performance A | Importance B | Performance B | Importance C | Performance C |
|---|---|---|---|---|---|---|
| John | 5 | 4 | 2 | 1 | 2 | 7 |
| Jane | 10 | 9 | 7 | 8 | 6 | 5 |
| Simon | 5 | 6 | 2 | 3 | 7 | 8 |
| Sarah | 5 | 9 | 8 | 2 | 3 | 7 |
I want to have a Radar chart that shows as per the below, averaging ths Candidate scores across A, B, C etc
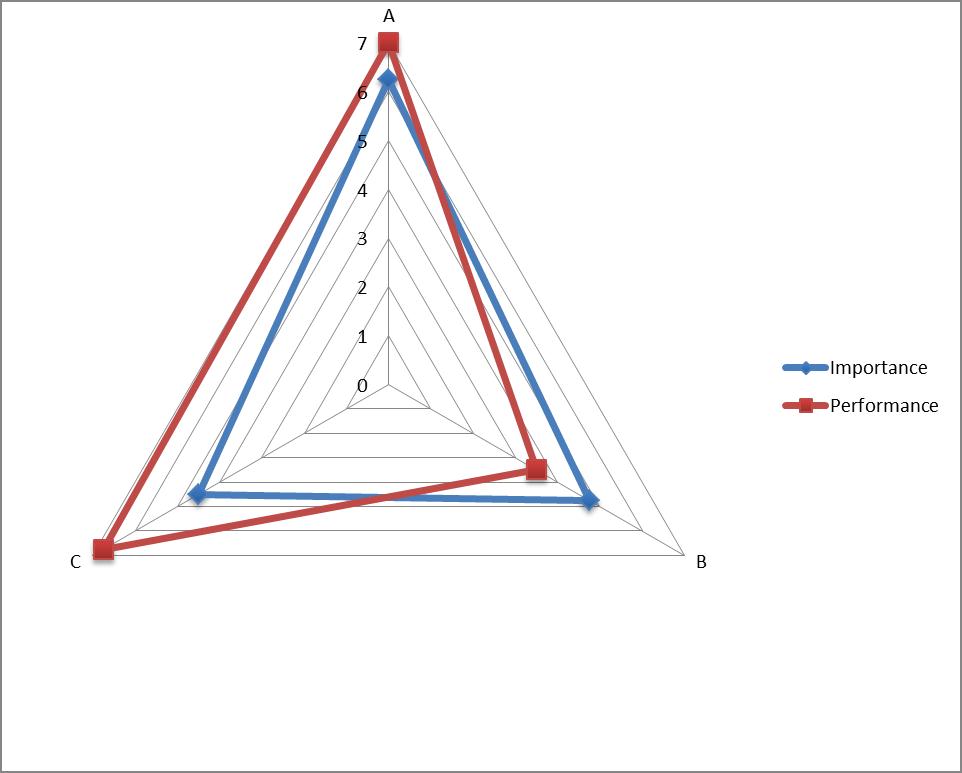
This is loaded as a staight file from Excel - I cannot get this to work in QV. Please advise!!
Thanks
Joe
656 Views
2 Replies
Partner - Champion III
2013-10-15
12:26 PM
- Mark as New
- Bookmark
- Subscribe
- Mute
- Subscribe to RSS Feed
- Permalink
- Report Inappropriate Content
Easiest is to transform your data a bit first. See attached qvw.
talk is cheap, supply exceeds demand
510 Views
Not applicable
2013-10-16
03:51 AM
Author
- Mark as New
- Bookmark
- Subscribe
- Mute
- Subscribe to RSS Feed
- Permalink
- Report Inappropriate Content
Thanks, but I really want to keep the data as it is - the actual data I'm using is more extensive than my example, so I want to keep it in its raw format.
I can get Importance and Performance on separate Radar charts - but I really want to show them on one.
Joe
510 Views