Unlock a world of possibilities! Login now and discover the exclusive benefits awaiting you.
- Qlik Community
- :
- All Forums
- :
- QlikView App Dev
- :
- Radar Chart - How to allow data overlapping with c...
Options
- Subscribe to RSS Feed
- Mark Topic as New
- Mark Topic as Read
- Float this Topic for Current User
- Bookmark
- Subscribe
- Mute
- Printer Friendly Page
Turn on suggestions
Auto-suggest helps you quickly narrow down your search results by suggesting possible matches as you type.
Showing results for
Not applicable
2017-01-09
11:31 AM
- Mark as New
- Bookmark
- Subscribe
- Mute
- Subscribe to RSS Feed
- Permalink
- Report Inappropriate Content
Radar Chart - How to allow data overlapping with choice of list-box
Question:
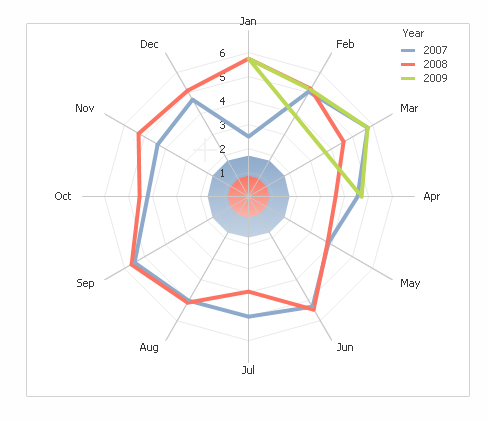
1. There are three years of monthly sales data.
2. There is a list box to allow user to choose which year to show in the chart.
3. Currently, I have a radar chart, which allows to show one year of data at one time. How can I configure the chart to allow choosing multiple years of data via list-box overlapping in the chart as follows?
Dimension: Month
Expression: Sales
Thanks in advance.
1,348 Views
1 Solution
Accepted Solutions
Partner - Champion III
2017-01-09
01:32 PM
- Mark as New
- Bookmark
- Subscribe
- Mute
- Subscribe to RSS Feed
- Permalink
- Report Inappropriate Content
Add Year as the second dimension to the radar chart
talk is cheap, supply exceeds demand
1,256 Views
2 Replies
Partner - Champion III
2017-01-09
01:32 PM
- Mark as New
- Bookmark
- Subscribe
- Mute
- Subscribe to RSS Feed
- Permalink
- Report Inappropriate Content
Add Year as the second dimension to the radar chart
talk is cheap, supply exceeds demand
1,257 Views
Not applicable
2017-01-09
01:46 PM
Author
- Mark as New
- Bookmark
- Subscribe
- Mute
- Subscribe to RSS Feed
- Permalink
- Report Inappropriate Content
Thanks, Gysbert. It works perfect.
1,256 Views