Unlock a world of possibilities! Login now and discover the exclusive benefits awaiting you.
Announcements
FLASH SALE: Save $500! Use code FLASH2026 at checkout until Feb 14th at 11:59PM ET. Register Now!
- Qlik Community
- :
- All Forums
- :
- QlikView App Dev
- :
- RangeSum at 2 Dimensions Chart
Options
- Subscribe to RSS Feed
- Mark Topic as New
- Mark Topic as Read
- Float this Topic for Current User
- Bookmark
- Subscribe
- Mute
- Printer Friendly Page
Turn on suggestions
Auto-suggest helps you quickly narrow down your search results by suggesting possible matches as you type.
Showing results for
Not applicable
2016-03-21
02:28 AM
- Mark as New
- Bookmark
- Subscribe
- Mute
- Subscribe to RSS Feed
- Permalink
- Report Inappropriate Content
RangeSum at 2 Dimensions Chart
Hi,
I had problem creating bar chart.
The "Chart-A" with setting:
- Dimensions: YEAR, MONTH
- Expressions: =RangeSum(ABOVE(SUM(YIELD),0,RowNo())) / MONTH * 12
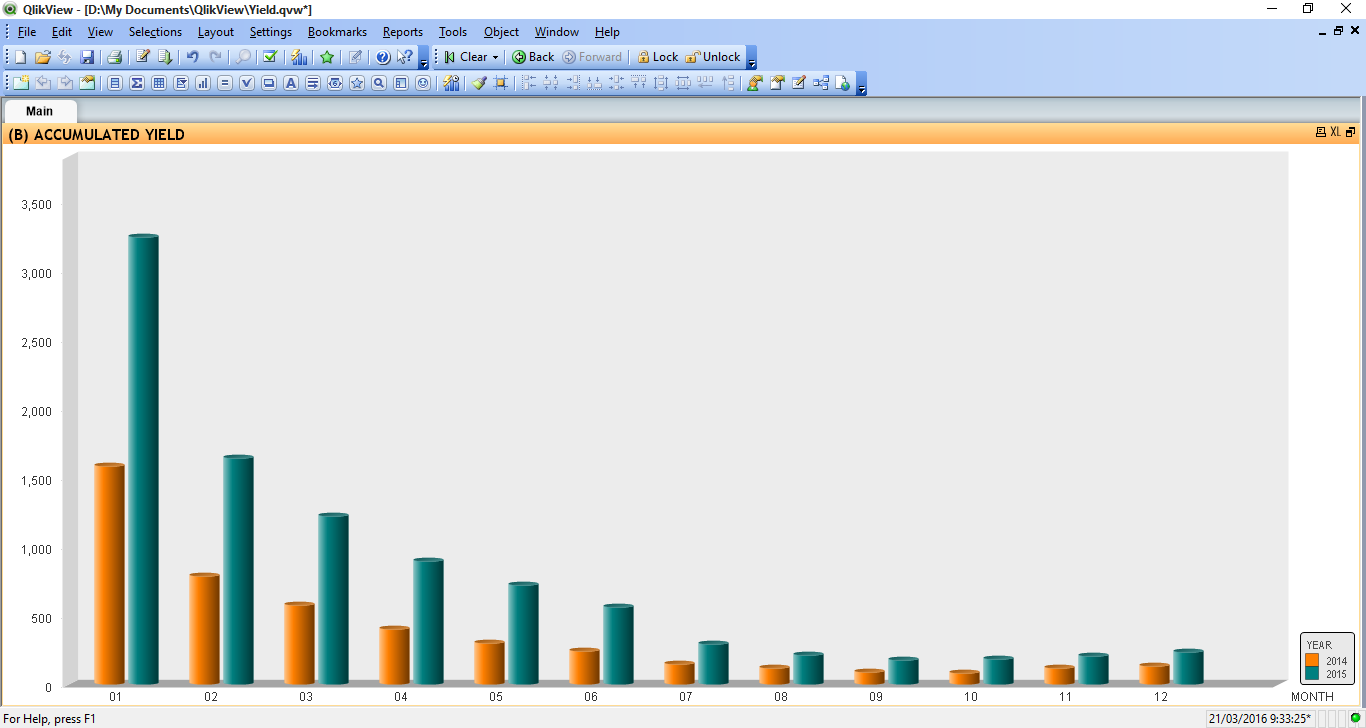
The "Chart-B" with setting:
- Dimensions: MONTH, YEAR
- Expressions: =RangeSum(ABOVE(SUM(YIELD),0,RowNo())) / MONTH * 12
Why the both showing different chart and figure as the table data are the same.
Can anyone help.
Thanks
954 Views
2 Replies
MVP
2016-03-21
03:46 AM
- Mark as New
- Bookmark
- Subscribe
- Mute
- Subscribe to RSS Feed
- Permalink
- Report Inappropriate Content
660 Views
Partner - Champion III
2016-03-21
04:12 AM
- Mark as New
- Bookmark
- Subscribe
- Mute
- Subscribe to RSS Feed
- Permalink
- Report Inappropriate Content
They are different because the order of the dimensions is different. The first groups the years per month, the other the months per year.
talk is cheap, supply exceeds demand
660 Views