Unlock a world of possibilities! Login now and discover the exclusive benefits awaiting you.
- Qlik Community
- :
- All Forums
- :
- QlikView App Dev
- :
- Rangesum expressions in combination with If (RowNo...
- Subscribe to RSS Feed
- Mark Topic as New
- Mark Topic as Read
- Float this Topic for Current User
- Bookmark
- Subscribe
- Mute
- Printer Friendly Page
- Mark as New
- Bookmark
- Subscribe
- Mute
- Subscribe to RSS Feed
- Permalink
- Report Inappropriate Content
Rangesum expressions in combination with If (RowNo ...) not working
Hi guys 
So I have a question that I know will probably be not that easy. I will add a data file for sure and I will give all information that I can possibly give.
So on the main sheet you will find some graphs/lists/boxes. Let me quickly address them all since they are in Dutch 
The first one are the months that I use to calculate revenue. They should be similar to English so you should be able to understand those.
Then there is a current selections box which is basic so no problem there.
Sale_order website is scrambled so just ignore.
In te vullen variabelen VOOR MERK: this is a box I use to make variables and give them values. All 6 are used in the first graph (Omzetevolutie merk).
First one: How much the brand must increase in order to be showed in the graph over a certain period.
Second: Same as first but not the limit so if a brand has risen more than this value, it will not be showed.
Third: Minimal revenue for the FIRST period
Fourth: Minimal revenue for the SECOND period
Fifth: The amount of months each period has. 6 means: we want to compare a total of 6 months to another total of 6 months.
Sixth: The amount of time between the 2 periods.
For example: fifth = 6 and sixth = 0 means that we want to compare 6 months to the previous 6 months.
This only works if the selected months are done right. After a lot of experimenting, I came up with a formula that made this work in every case, no matter how long the periods/time between periodes (but ofcourse within the possible time of the file so not more than 40 something months). So for 6 and 0 (fifht/sixth variable) I need to select 12 months.
Productnaam list is the list of products with their name. They are scrambled however. There is also 1 brand in the file: Mbrrbb (scrambled) so this is the only brand to work with.
The first graph shows evolution of this brand in revenue over a certain period. For the 6 and 0 this means that the last 6 selected months, have a revenue of 25.88 thousand and the 6 months before had 15.46 thousand. The difference is 10.42 thousand and this is an increase of 67.42% (these values are all shown in the graph next to the datapoint). Note that changing the variables could result in omitting this brand so keep the minimum revenues as low as possible (1000 will do) and keep the min and max increase high (so -100% and like 1000% for the max change so that this does not interrupt anything).
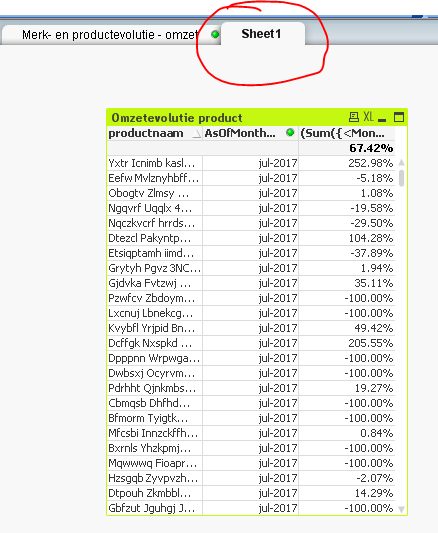
The second one shows evolution of all products within this brand. But, and this is the problem: it does not show all products of this brand. Only the ones that have 12 data points (so 1 value for every selected month) are calculated. The others (with 11 or less values) are not calculated because of how the expression is created (with RowNo() >= ....).
My question now is: how can I have all products listed in there, not matter how much data points they have? And they have to be seperated in the right way ofcourse. If the product has 1 value in the first 6 months and 2 values in the next 6 months, it should calculate the difference between those 2 periods correctly without mixing the values up in the different periods.
This is a hard question I guess so if u need more material or some example of what the values should be or the output, just ask and I'll see what I can do
Kind regards and thanks in advance!!!
- « Previous Replies
-
- 1
- 2
- Next Replies »
- Mark as New
- Bookmark
- Subscribe
- Mute
- Subscribe to RSS Feed
- Permalink
- Report Inappropriate Content
Bro You're Patience  . Hats Off.
- Mark as New
- Bookmark
- Subscribe
- Mute
- Subscribe to RSS Feed
- Permalink
- Report Inappropriate Content
- Mark as New
- Bookmark
- Subscribe
- Mute
- Subscribe to RSS Feed
- Permalink
- Report Inappropriate Content
The range should at max be 24 but I do not control that. If my supervisor wants to see certain information, he/she should be able to access that. The most common things are yearly basis analyses so last 12 months compared to 12 months before that (total 24 months).
What exactly do you mean with the source files? Can I help with something?
- Mark as New
- Bookmark
- Subscribe
- Mute
- Subscribe to RSS Feed
- Permalink
- Report Inappropriate Content
Check the attached
- Mark as New
- Bookmark
- Subscribe
- Mute
- Subscribe to RSS Feed
- Permalink
- Report Inappropriate Content
This appears to be correct. So the only way to do this is by editing the script and creating this new field: AsOfMonth?
I'll see if this can be implemented in the current script and then I will let you know if it works (prob next week).
I assume this is the correct answer so I'll flag it as solved ^^
Now I just have to understand the expression But will figure it out!
- « Previous Replies
-
- 1
- 2
- Next Replies »