Unlock a world of possibilities! Login now and discover the exclusive benefits awaiting you.
- Qlik Community
- :
- All Forums
- :
- QlikView App Dev
- :
- Rangesum
- Subscribe to RSS Feed
- Mark Topic as New
- Mark Topic as Read
- Float this Topic for Current User
- Bookmark
- Subscribe
- Mute
- Printer Friendly Page
- Mark as New
- Bookmark
- Subscribe
- Mute
- Subscribe to RSS Feed
- Permalink
- Report Inappropriate Content
Rangesum
Hi All,
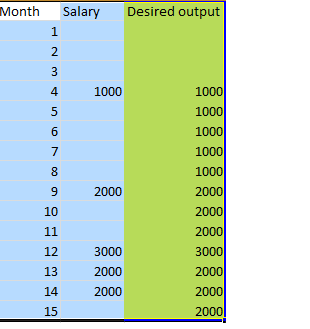
We need to fill the 'salary Triangulations' with the above value if the below value is null or zero and if the value exist the value should display.
i.e. for the Month from 5 to 8 it should come 1000 and then for 9 it should be 2000 and for month 10-11 it should be 2000 and should go on like that.
Currently the formula I applied is taking the sum and displaying it i.e. 1000 +2000 and displaying the sum of 3000.
Attached the excel sheet and qvw. Please adivse
Thanks,
Sijo
Accepted Solutions
- Mark as New
- Bookmark
- Subscribe
- Mute
- Subscribe to RSS Feed
- Permalink
- Report Inappropriate Content
See if this helps:

Expression: If(Sum123 = 0, Alt(Above(Sum123), 0), Sum(Salary))
Here Sum123 is the expression label and hence it is Blue in color.
- Mark as New
- Bookmark
- Subscribe
- Mute
- Subscribe to RSS Feed
- Permalink
- Report Inappropriate Content
Are you trying to do this in the script or on a front end chart? Cannot open your QVW as I am working with personal edition of QlikView.
- Mark as New
- Bookmark
- Subscribe
- Mute
- Subscribe to RSS Feed
- Permalink
- Report Inappropriate Content
I am trying to do this in chart, not in script
- Mark as New
- Bookmark
- Subscribe
- Mute
- Subscribe to RSS Feed
- Permalink
- Report Inappropriate Content
Add the image with the field Desired output
- Mark as New
- Bookmark
- Subscribe
- Mute
- Subscribe to RSS Feed
- Permalink
- Report Inappropriate Content
See if this helps:
Expression: If(Sum123 = 0, Alt(Above(Sum123), 0), Sum(Salary))
Here Sum123 is the expression label and hence it is Blue in color.
- Mark as New
- Bookmark
- Subscribe
- Mute
- Subscribe to RSS Feed
- Permalink
- Report Inappropriate Content
hi sijo,
If(len(trim(Sum(Salary))) = 0, Above(Sum(Salary)), Sum(Salary))