Unlock a world of possibilities! Login now and discover the exclusive benefits awaiting you.
- Qlik Community
- :
- All Forums
- :
- QlikView App Dev
- :
- Re: Re-using the FirstSortedValue on subsequent ro...
- Subscribe to RSS Feed
- Mark Topic as New
- Mark Topic as Read
- Float this Topic for Current User
- Bookmark
- Subscribe
- Mute
- Printer Friendly Page
- Mark as New
- Bookmark
- Subscribe
- Mute
- Subscribe to RSS Feed
- Permalink
- Report Inappropriate Content
Re-using the FirstSortedValue on subsequent rows
Hi experts
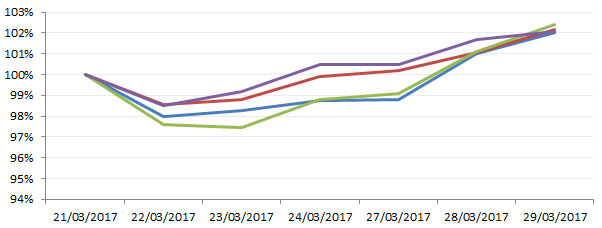
In my data set, I'm trying to get the earliest stock price for each stock, based on the users' selections of both stocks and dates. This is so I can show a % movement, always starting with a base of 100% for each stock, regardless of the user's selection.
Below is a sample data set and how I'd like the output to look.
I've got as far as FirstVal = aggr(FirstSortedValue(Close,Date),Co)
(I'm not sure why this appears only on the second line!)
What I would like to understand is: How do I get the First Val on to every line, so that I can use it to calculate the stock price re-based to the user's date range?
Many thanks!
| Date | Co | Close | First Val |
| 21/03/2017 | Co A | 84.42 | - |
| 22/03/2017 | Co A | 82.71 | 84.42 |
| 23/03/2017 | Co A | 82.95 | - |
| 24/03/2017 | Co A | 83.38 | - |
| 27/03/2017 | Co A | 83.4 | - |
| 28/03/2017 | Co A | 85.26 | - |
| 29/03/2017 | Co A | 86.14 | - |
| 21/03/2017 | Co B | 43.92 | - |
| 22/03/2017 | Co B | 43.29 | 43.92 |
| 23/03/2017 | Co B | 43.4 | - |
| 24/03/2017 | Co B | 43.88 | - |
| 27/03/2017 | Co B | 44 | - |
| 28/03/2017 | Co B | 44.38 | - |
| 29/03/2017 | Co B | 44.88 | - |
| 21/03/2017 | Co C | 34.32 | - |
| 22/03/2017 | Co C | 33.49 | 34.32 |
| 23/03/2017 | Co C | 33.44 | - |
| 24/03/2017 | Co C | 33.9 | - |
| 27/03/2017 | Co C | 34 | - |
| 28/03/2017 | Co C | 34.7 | - |
| 29/03/2017 | Co C | 35.14 | - |
| 21/03/2017 | Co D | 25.82 | - |
| 22/03/2017 | Co D | 25.43 | 25.82 |
| 23/03/2017 | Co D | 25.61 | - |
| 24/03/2017 | Co D | 25.94 | - |
| 27/03/2017 | Co D | 25.94 | - |
| 28/03/2017 | Co D | 26.25 | - |
| 29/03/2017 | Co D | 26.35 | - |
- Mark as New
- Bookmark
- Subscribe
- Mute
- Subscribe to RSS Feed
- Permalink
- Report Inappropriate Content
Answered my own question! I posted this after ages trying to crack it. As soon as I returned to the problem after posting, I figured it out:
aggr( NODISTINCT FirstSortedValue(Close,Date),Co)
Hope this helps someone in the future.