Unlock a world of possibilities! Login now and discover the exclusive benefits awaiting you.
- Qlik Community
- :
- All Forums
- :
- QlikView App Dev
- :
- Really odd behavior
- Subscribe to RSS Feed
- Mark Topic as New
- Mark Topic as Read
- Float this Topic for Current User
- Bookmark
- Subscribe
- Mute
- Printer Friendly Page
- Mark as New
- Bookmark
- Subscribe
- Mute
- Subscribe to RSS Feed
- Permalink
- Report Inappropriate Content
Really odd behavior
Hi all.
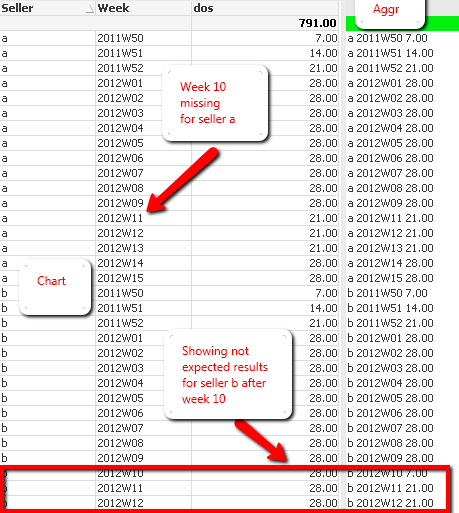
I have an expression which calculates days depending if the previous 3 weeks are there in the data. For example, if 2012W23 to 2012W27 is there for every seller, the result is 28 days for every week, if there is one week missing, i.e. 2012W25 the result is 21 days, if there are 2 weeks missing i.e. 2012W23 and 2012W25, the result is 14 days, if all 3 previous weeks are missing, the result is 7 days.
This seems to be working well in a straight table. I take the average of rows as a total, and the result is quite fine. it does not matter which weeks are missing, the result is as expected.
But I need to present this average of rows as one number in a text box, so the obvious choice was to aggr the expression over seller and week, in order to mimic the chart. See attached file.
If all weeks are present, the aggr gives the same result as the chart.
If week 2012W12 for seller a is omitted, the aggr gives the same result as the chart.
If week 2012W09 for seller a is omitted and seller b has data up to week 2012W10, the aggr gives the same result as the chart.
If week 2012W09 for seller a is omitted and seller b has weeks present over week 2012W10 for example 2012W11, the result is different.
You can try these scnarios in the attached file.
I only want to aggr the values the chart is showing, I cannot understand why it is related to data. The chart is working, the aggr is not, depending on the data.
Any ideas?
Accepted Solutions
- Mark as New
- Bookmark
- Subscribe
- Mute
- Subscribe to RSS Feed
- Permalink
- Report Inappropriate Content
If it's order by the same way - you get the same result 
I guess, I add some fields so that I can avoid interrecord functions.
Whatever, your expression does not imply user selections.
- Mark as New
- Bookmark
- Subscribe
- Mute
- Subscribe to RSS Feed
- Permalink
- Report Inappropriate Content
I created a list box with the text box expression to see where the difference comes from. It seems that when a week, for example 2012W09 is missing from Seller a, seller b has wrong results from 2012W09 and onwards. I cannot understand why this happens in the aggr only and not the chart itself :
- Mark as New
- Bookmark
- Subscribe
- Mute
- Subscribe to RSS Feed
- Permalink
- Report Inappropriate Content
I guess, the problem is with your expression not with aggr.
You use inter record functions with aggr.
Why do you expect that tha data representation and sorting for (inside) aggr is the same as in your chart ?
- Mark as New
- Bookmark
- Subscribe
- Mute
- Subscribe to RSS Feed
- Permalink
- Report Inappropriate Content
Try 'load order' as sort order and you'll see the difference.
- Mark as New
- Bookmark
- Subscribe
- Mute
- Subscribe to RSS Feed
- Permalink
- Report Inappropriate Content
True but that is what aggr function is doing. It is ordering the same way, as you can see from the comparison between the chart and the list box.
How would you solve this?
- Mark as New
- Bookmark
- Subscribe
- Mute
- Subscribe to RSS Feed
- Permalink
- Report Inappropriate Content
If it's order by the same way - you get the same result
I guess, I add some fields so that I can avoid interrecord functions.
Whatever, your expression does not imply user selections.
- Mark as New
- Bookmark
- Subscribe
- Mute
- Subscribe to RSS Feed
- Permalink
- Report Inappropriate Content
Well, I was first pissed with whitelines's answer, but then I thought I look into it a little. And yes, whiteline was right, aggr takes load order by default, it always does, and since 2012W09 was missing from the first seller the order was as follows :
....
2012W08
2012W09
2012W11
2012W12
2012W10 (since this week was only found for seller b!!)
So I simply loaded the weeks seperately in the desired order and now everything works fine! See attached file. A simple list box with weeks ordered by load revealed the schocking, but to be expected truth!
Sorry whiteline for all the nasty thoughts I made , you were really helpfull!
Thank you.
- Mark as New
- Bookmark
- Subscribe
- Mute
- Subscribe to RSS Feed
- Permalink
- Report Inappropriate Content
It's ok. Never mind. I think its normal to be in doubt about comunity comments.
At least you've tried it and I've found something useful too.