Unlock a world of possibilities! Login now and discover the exclusive benefits awaiting you.
- Qlik Community
- :
- All Forums
- :
- QlikView App Dev
- :
- Reference Line show in the top
- Subscribe to RSS Feed
- Mark Topic as New
- Mark Topic as Read
- Float this Topic for Current User
- Bookmark
- Subscribe
- Mute
- Printer Friendly Page
- Mark as New
- Bookmark
- Subscribe
- Mute
- Subscribe to RSS Feed
- Permalink
- Report Inappropriate Content
Reference Line show in the top
Hi all,
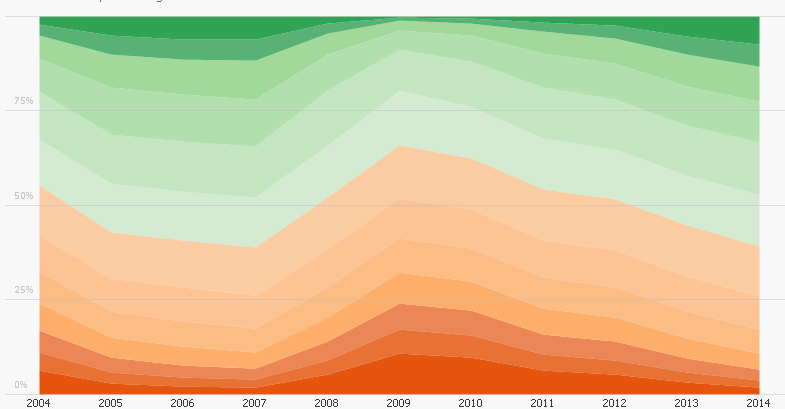
I use reference line my chart. But I could not make it to show the 100% value in the top of reference line. Could anyone tell me how to solve this problem?
Jelly
Accepted Solutions
- Mark as New
- Bookmark
- Subscribe
- Mute
- Subscribe to RSS Feed
- Permalink
- Report Inappropriate Content
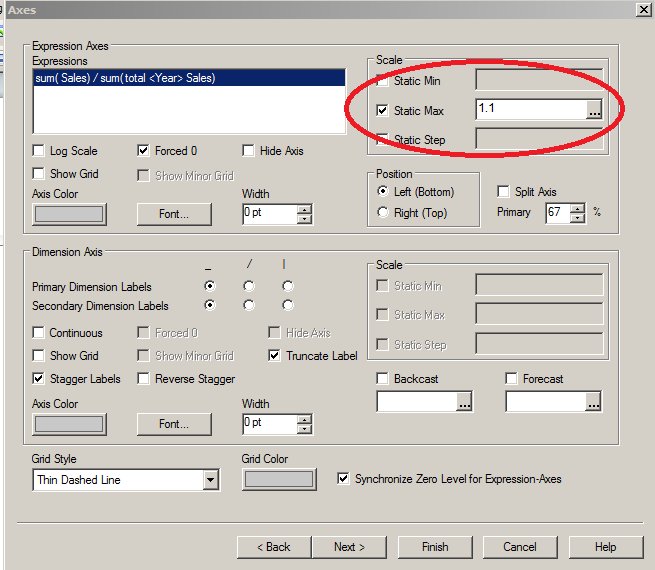
Sure , make the static max value on the y axis equal to 110% or 1.1 for example. Then the reference line will always be visible and not hidden at the border.
- Mark as New
- Bookmark
- Subscribe
- Mute
- Subscribe to RSS Feed
- Permalink
- Report Inappropriate Content
Sure , make the static max value on the y axis equal to 110% or 1.1 for example. Then the reference line will always be visible and not hidden at the border.
- Mark as New
- Bookmark
- Subscribe
- Mute
- Subscribe to RSS Feed
- Permalink
- Report Inappropriate Content
Hi Jonathan,
Thanks so much! The method you provided do work! And I also want to know whether there is another method? Since I looked other people's chart and the static max is 1 and also the reference line is 100, it also could work....
Thanks!
Jelly
- Mark as New
- Bookmark
- Subscribe
- Mute
- Subscribe to RSS Feed
- Permalink
- Report Inappropriate Content
You could keep the max at 1 and then add a 'text in chart' on the presentation tab of 100%. Then hold down shift/ctrl keys at the same time, click the chart and you will see red lines appear around all the movable elements in the chart including the '100%' text in chart item. Just move that to wherever you want.
- Mark as New
- Bookmark
- Subscribe
- Mute
- Subscribe to RSS Feed
- Permalink
- Report Inappropriate Content
Thanks so much!