Unlock a world of possibilities! Login now and discover the exclusive benefits awaiting you.
- Qlik Community
- :
- All Forums
- :
- QlikView App Dev
- :
- Remove the -
- Subscribe to RSS Feed
- Mark Topic as New
- Mark Topic as Read
- Float this Topic for Current User
- Bookmark
- Subscribe
- Mute
- Printer Friendly Page
- Mark as New
- Bookmark
- Subscribe
- Mute
- Subscribe to RSS Feed
- Permalink
- Report Inappropriate Content
Remove the -
Hello,
I´ve created a new column where I have to count a lot of documents. Into of these documents some information appears with the caracter - .
for example DOC COUNTRY RESULT(COUNT)
1 COL 1
2 ARG 1
3 BR -
4 ESC -
5 ALE 1
Then,
How can I remove the cells with - into my formula?
Thanks.
- « Previous Replies
-
- 1
- 2
- Next Replies »
- Mark as New
- Bookmark
- Subscribe
- Mute
- Subscribe to RSS Feed
- Permalink
- Report Inappropriate Content
If I understand your issue correctly, the '-' is a null value. On the dimensions tab in Properties, check the 'Suppress When Value Is Null' option.
- Mark as New
- Bookmark
- Subscribe
- Mute
- Subscribe to RSS Feed
- Permalink
- Report Inappropriate Content
If you get null values in your expression column, then you have probably unselected Suppress Zero Values.
Chart Properties > Presentation > Suppress Zero Values
- Mark as New
- Bookmark
- Subscribe
- Mute
- Subscribe to RSS Feed
- Permalink
- Report Inappropriate Content
Hello,
When you load in the table you could have it check to see if there is a null value and have it be replaced with a 0.
Regards,
Jeff
- Mark as New
- Bookmark
- Subscribe
- Mute
- Subscribe to RSS Feed
- Permalink
- Report Inappropriate Content
Hi thank you for your answers.
I forgot to say that option is already checked. But only show the option that you want. For example "0".
The row has to dissappear entire. for example the fifth has to disappear. and no change the "-".
Thanks.
- Mark as New
- Bookmark
- Subscribe
- Mute
- Subscribe to RSS Feed
- Permalink
- Report Inappropriate Content
Hello,
If none of the information is needed then you can do this in the loading of the table. If the value in the column = null or "-" then don't load in that row. If you want the information to still be there but just with the two fields containing "-" then you would have to do something in a macro such as an onOpen process, I believe.
Regards,
Jeff
- Mark as New
- Bookmark
- Subscribe
- Mute
- Subscribe to RSS Feed
- Permalink
- Report Inappropriate Content
I think that you think that is a dimension column. 
But those columns are expressions:
=Date#(Mid(Fecha, 1,9)).
come values gives me a "-".
I tried this but doesn´t work.
=if(Date#(Mid(Fecha, 1,9)) = '-', null(), Date#(Mid(Fecha, 1,9)))
Thanks.
- Mark as New
- Bookmark
- Subscribe
- Mute
- Subscribe to RSS Feed
- Permalink
- Report Inappropriate Content
Any Ideas!
- Mark as New
- Bookmark
- Subscribe
- Mute
- Subscribe to RSS Feed
- Permalink
- Report Inappropriate Content
In the Presentation tab for the chart, change the Null Symbol value to " ".
-Rob
- Mark as New
- Bookmark
- Subscribe
- Mute
- Subscribe to RSS Feed
- Permalink
- Report Inappropriate Content
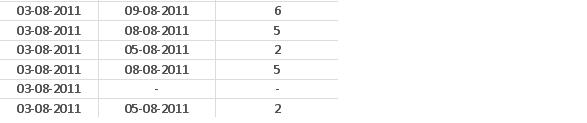
Even if the appropriate options (like suppress zero values) are checked, the row won't disappear if one of the expressions returns a value >0.
If the first column (the one with all 03-08-2011) is also an expression, the rows are shown, because this column shows a valid value.
So, either move this date column to the dimensions, if possible, or make the expression conditional with regard to output of the other columns.
Besides that, I assume that the other two columns show '-' as indication of NULL. I think it might also be possible that this indicates a non unique return value, i.e. the expression returns more than one value. You could check this e.g. by adding a max() to your expression.
Hope this helps,
Stefan
P.S. In cases like this, it is best if you could post an example showing your issue, it is hard to tell from a screenshot what's going on here.
- « Previous Replies
-
- 1
- 2
- Next Replies »