Unlock a world of possibilities! Login now and discover the exclusive benefits awaiting you.
- Qlik Community
- :
- All Forums
- :
- QlikView App Dev
- :
- Require some pointers and examples please
- Subscribe to RSS Feed
- Mark Topic as New
- Mark Topic as Read
- Float this Topic for Current User
- Bookmark
- Subscribe
- Mute
- Printer Friendly Page
- Mark as New
- Bookmark
- Subscribe
- Mute
- Subscribe to RSS Feed
- Permalink
- Report Inappropriate Content
Require some pointers and examples please
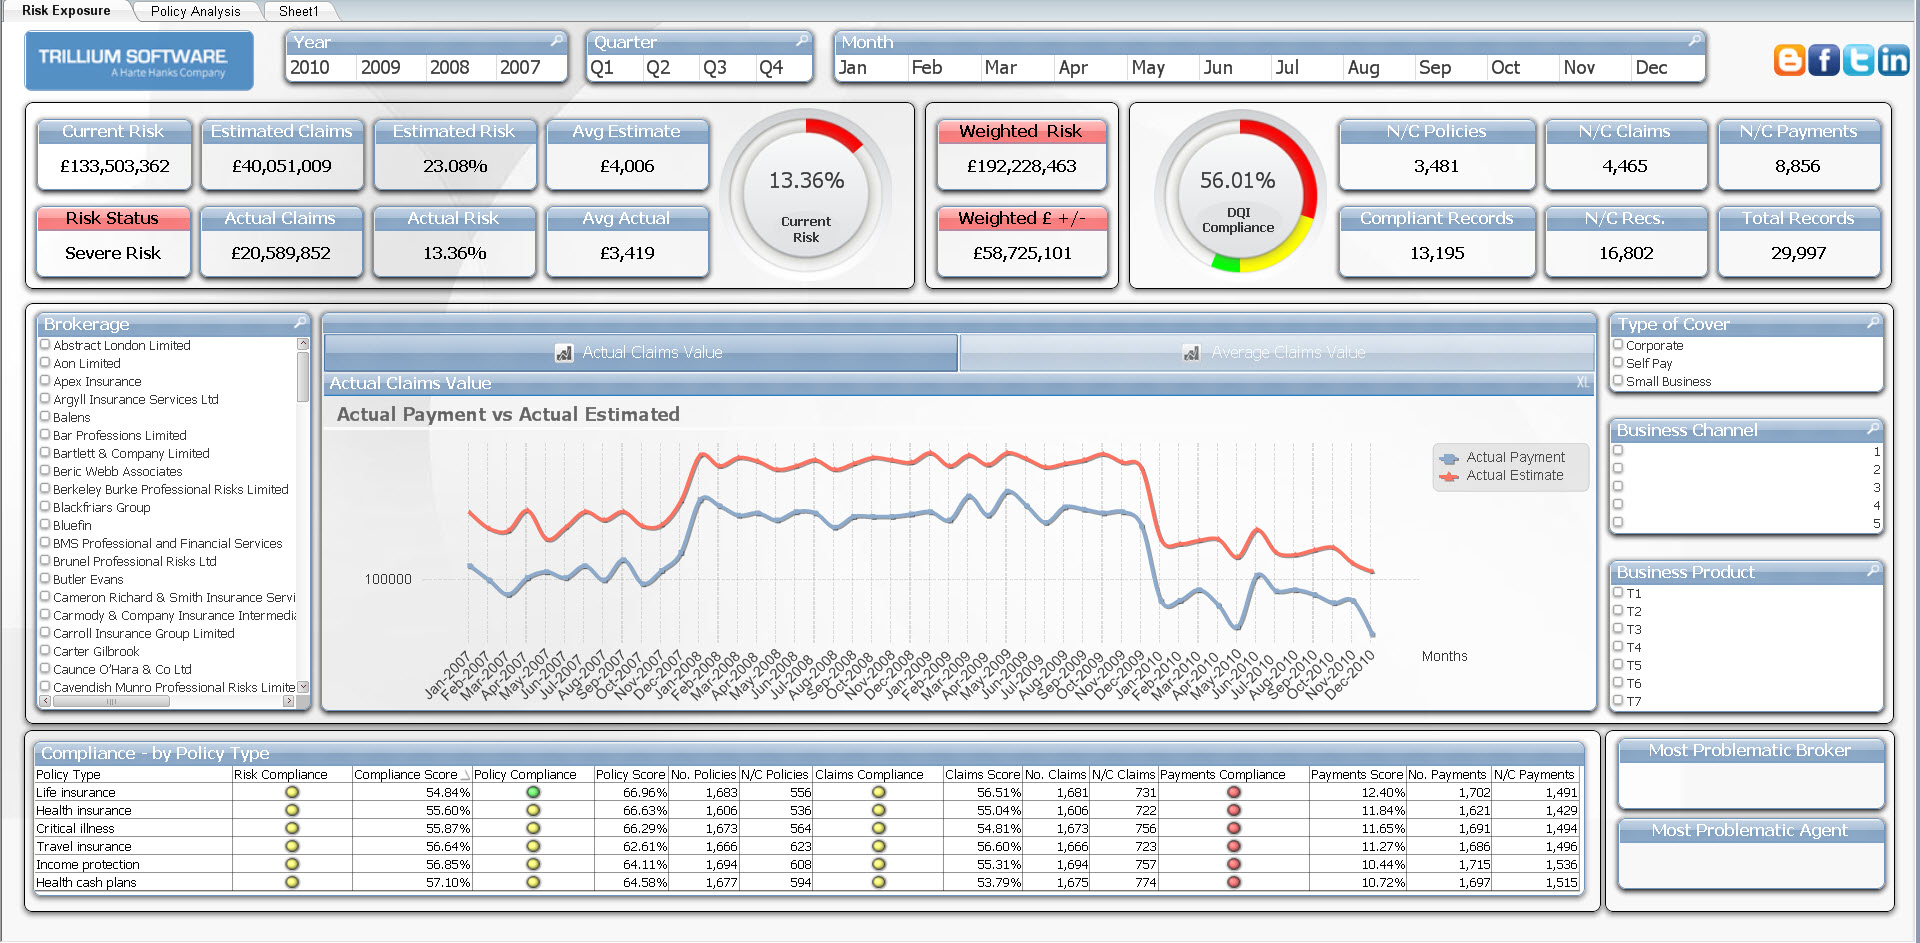
I am working on a demo app as below that basically shows the current Risk and exposure of an Insurance company - offset by the quality of the data underpinning the report .. made up of a mixture of the raw data tables and a feed from a data quality tool.
All working as expected currently (I think!!)
I want to be able to show the worst (top) offender for Data Quality by both the brokerage and the agent responsible for the payments - as the user selects various time segments or products etc. Data model below as well...
So ..App
Data Model
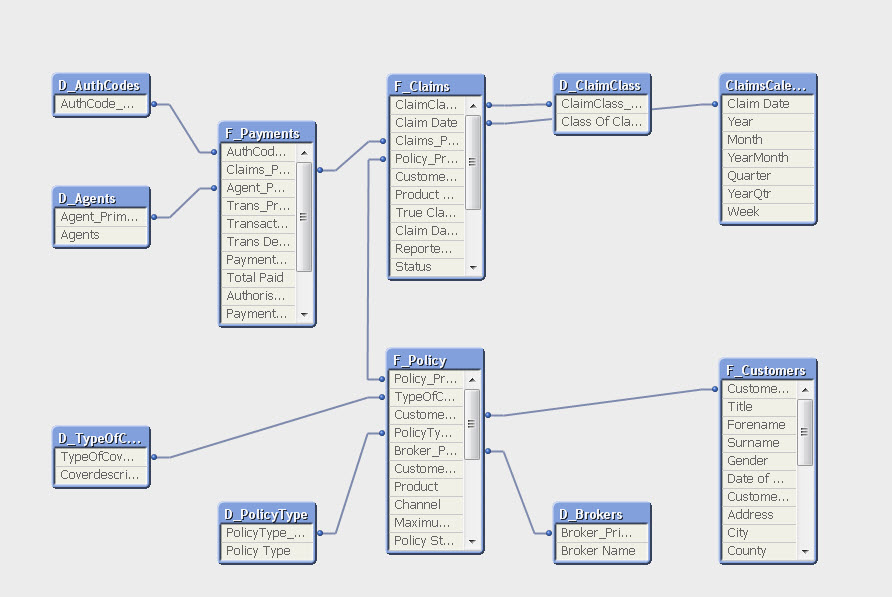
Each Fact table has a compliance score - Pass of Fail
So if a user is looking at 2013 - Q2 for Travel Insurance -- I want to see the broker who has the highest failing compliance count of Claims + Policy + Payments.. and like wise for the Agent.
Any pointers would be most appreciated.
Accepted Solutions
- Mark as New
- Bookmark
- Subscribe
- Mute
- Subscribe to RSS Feed
- Permalink
- Report Inappropriate Content
Fixed the problem ...
=FirstSortedValue([Broker Name],- aggr(Count({1<[Claims Compliance]={'Fail'}>}[Claims Compliance])+ Count ({<[Payments Compliance]={'Fail'}>}[Payments Compliance])+Count ({<[Policy Compliance]={'Fail'}>}[Policy Compliance]), [Broker Name]) )
- Mark as New
- Bookmark
- Subscribe
- Mute
- Subscribe to RSS Feed
- Permalink
- Report Inappropriate Content
Did not get you
- Mark as New
- Bookmark
- Subscribe
- Mute
- Subscribe to RSS Feed
- Permalink
- Report Inappropriate Content
Sorry .. so a little simpler ..
regard less of what selection the user makes .. by Product/type/date
I want to show the broker with the highest count of failing records within that selection. Rank no 1?
- Mark as New
- Bookmark
- Subscribe
- Mute
- Subscribe to RSS Feed
- Permalink
- Report Inappropriate Content
So far I have this in the text box - but it is giving me a null/empty value
=only({<[Broker Name]={"=rank(Count ({<[Claims Compliance]={'Fail'}>}[Claims Compliance])+ Count ({<[Payments Compliance]={'Fail'}>}[Payments Compliance])+Count ({<[Policy Compliance]={'Fail'}>}[Policy Compliance]),[Broker Name])) =1"}>}[Broker Name])
- Mark as New
- Bookmark
- Subscribe
- Mute
- Subscribe to RSS Feed
- Permalink
- Report Inappropriate Content
Fixed the problem ...
=FirstSortedValue([Broker Name],- aggr(Count({1<[Claims Compliance]={'Fail'}>}[Claims Compliance])+ Count ({<[Payments Compliance]={'Fail'}>}[Payments Compliance])+Count ({<[Policy Compliance]={'Fail'}>}[Policy Compliance]), [Broker Name]) )