Unlock a world of possibilities! Login now and discover the exclusive benefits awaiting you.
- Qlik Community
- :
- All Forums
- :
- QlikView App Dev
- :
- Restructuring Data on Loading
- Subscribe to RSS Feed
- Mark Topic as New
- Mark Topic as Read
- Float this Topic for Current User
- Bookmark
- Subscribe
- Mute
- Printer Friendly Page
- Mark as New
- Bookmark
- Subscribe
- Mute
- Subscribe to RSS Feed
- Permalink
- Report Inappropriate Content
Restructuring Data on Loading
Hi QlikView Experts,
Can someone help me please?
I am trying to restructure a data set upon loading it into Qlikview. What I want is for the status dates to appear as the field with the data values as the data within the field for each document number.
To give a simplified example:
My data structure currently is:
| DocNumber | Status | Date |
| 1 | Scanned | 01/08/2011 |
| 1 | Waiting Coder Action | 03/08/2011 |
| 1 | In Query | 05/08/2011 |
| 1 | Waiting Payment | 07/08/2011 |
| 2 | Scanned | 07/08/2011 |
| 2 | Waiting Coder Action | 09/08/2011 |
| 2 | In Query | 11/08/2011 |
| 3 | Scanned | 13/08/2011 |
| 2 | Waiting Payment | 15/08/2011 |
| 2 | Completed | 17/08/2011 |
| 4 | Scanned | 19/08/2011 |
| 4 | Waiting Coder Action | 21/08/2011 |
| 4 | In Query | 23/08/2011 |
And I need to be able to look at the time lags between status dates so need QlikView to restructure the data into the table format below:
| DocNumber | Completed | In Query | Scanned | Waiting Coder Action | Waiting Payment |
| 1 | 05/08/2011 | 01/08/2011 | 03/08/2011 | 07/08/2011 | |
| 2 | 17/08/2011 | 11/08/2011 | 07/08/2011 | 09/08/2011 | 15/08/2011 |
| 3 | 13/08/2011 | ||||
| 4 | 23/08/2011 | 19/08/2011 | 21/08/2011 |
Is this possible? If so, how?
To be more specific there are around 30-40 statuses with a seperate line in the current data set for each.
Kind Regards
Becky
- Mark as New
- Bookmark
- Subscribe
- Mute
- Subscribe to RSS Feed
- Permalink
- Report Inappropriate Content
Hi,
Yes it is possible you need to crate a pivot table in this type of requirements on that you need to create a pivot table and arrange a table like you want it by drag and drop the fields.
Anand
- Mark as New
- Bookmark
- Subscribe
- Mute
- Subscribe to RSS Feed
- Permalink
- Report Inappropriate Content
Hi,
There is no limit for the status column if there is many types of the status available it will create by the pivot table.
Just put DocNumber, Status field in the Dimensions and in expression date field.
And after creating of the pivot table just click on the Status column and drag it towards the right top corner then you see the Status column goes upwards.
And let me know
Regards
Anand
- Mark as New
- Bookmark
- Subscribe
- Mute
- Subscribe to RSS Feed
- Permalink
- Report Inappropriate Content
Hi RB
You can use Generic Load
Generic LOAD DocNumber,
Status,
Date
FROM
indata.txt
(txt, codepage is 1252, embedded labels, delimiter is '\t', msq);
Heres an example of a straight table chart using the loaded data:
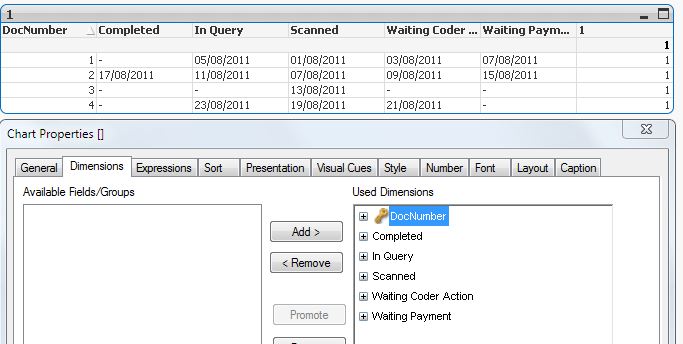
hth/gg
- Mark as New
- Bookmark
- Subscribe
- Mute
- Subscribe to RSS Feed
- Permalink
- Report Inappropriate Content
Hi All,
Many thanks for such quick responses they are much appreciated. Unfortunately the pivot tables do not give the required data structure as I need to start analysing the times between the different statuses. e.g.
| DocNumber | Time From Scan To Waiting Coder Action | Time From Waiting Coder Action To In Query | Time From In Query To Waiting Payment | Time From Waiting Payment To Completed | Total Time to complete | Total Time in System |
| 1 | 2 | 2 | 2 | 6 | ||
| 2 | 2 | 2 | 4 | 2 | 10 | 10 |
| 3 | 0 | |||||
| 4 | 2 | 2 | 4 |
And whilst I could use something such as the min to max total times, what I really want to know is how long the document has spent in each status. Therefore, I think that I need to restructure the data upon loading (unless there is a more intelligent way that I'm missing).
To make matters even more interesting, documents can move back and forth between statuses e.g. go in and out of query and therefore the total time in query is more important than the date. Is this possible to calculate in QlikView?
Once again, many thanks for all your help
Becky
- Mark as New
- Bookmark
- Subscribe
- Mute
- Subscribe to RSS Feed
- Permalink
- Report Inappropriate Content
How about this then:

the load script:
Docs:
LOAD DocNumber,
Status,
Date
FROM
145324.txt
(txt, codepage is 1252, embedded labels, delimiter is '\t', msq);
Left Join (Docs)
Load DocNumber,
Max(Date)-Min(Date) As DaysInSystem
Resident Docs
Group By DocNumber;
StatusSort:
LOAD * INLINE [
Status, StatusSort
Scanned, 1
Waiting Coder Action, 2
In Query, 3
Waiting Payment, 4
Completed, 5
];
hth/gg
- Mark as New
- Bookmark
- Subscribe
- Mute
- Subscribe to RSS Feed
- Permalink
- Report Inappropriate Content
Hi,
See if this is what you are looking for.
Cheers.
- Mark as New
- Bookmark
- Subscribe
- Mute
- Subscribe to RSS Feed
- Permalink
- Report Inappropriate Content
Hi,
See the attached sample if it is work for you. let me know if it is correct or not.
Regards
Anand
- Mark as New
- Bookmark
- Subscribe
- Mute
- Subscribe to RSS Feed
- Permalink
- Report Inappropriate Content
Hi All,
A huge thanks for all your help on this issue.
I apologise for the late response, but it is really interesting and useful to know all the different ways that this can be achieved and I have adapted bits from a couple of the solutions mentioned above due to the different data sets I am receiving, therefore sorry that I couldn't tell you who have the "correct answer" as they all worked!
Kind Regards
RB