Unlock a world of possibilities! Login now and discover the exclusive benefits awaiting you.
- Qlik Community
- :
- All Forums
- :
- QlikView App Dev
- :
- Rolling 12 Month Sales using Set Analysis Chart So...
- Subscribe to RSS Feed
- Mark Topic as New
- Mark Topic as Read
- Float this Topic for Current User
- Bookmark
- Subscribe
- Mute
- Printer Friendly Page
- Mark as New
- Bookmark
- Subscribe
- Mute
- Subscribe to RSS Feed
- Permalink
- Report Inappropriate Content
Rolling 12 Month Sales using Set Analysis Chart Sort?
Hello
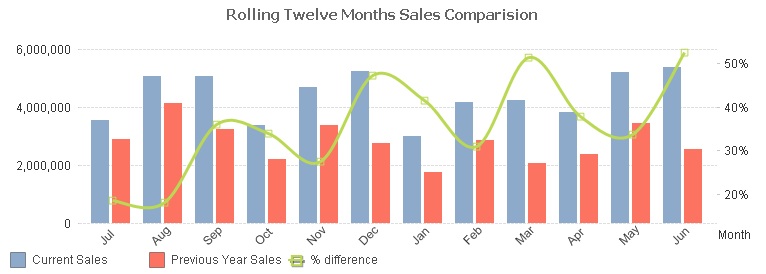
I am struggling with the following problem, i have a chart that need to compare over months this years sales and the previous years sales however the graph needs to be dynamic in that it changes in accordance with the users selections, the following is my current expression;
Current Sales: sum({1<OrderDate={">=$(=addmonths(monthend(max(OrderDate))+1,-12)) <=$(=max(OrderDate))"}>}Sales)
Previous Sales: sum({1<OrderDate={">=$(=addmonths(monthend(max(OrderDate),)+1,-24)) <=$(=addmonths(max(OrderDate),-12))"}>}Sales)
% difference: (Column(1)-Column(2))/Column(1)

This works fine when a year is selected however when i select a month for example if the Fiscal Year 08/09 is selected as above and i click the month of May what i would like to see is Jun 08 to May 09 (Current Sales) and Jun 07 to May 08 (Previous Sales), this works with regards the dates but the order of the Month in the chart does not relate properly.
Any help would be greatly appreciated.
Message was edited by: shay.cooper I have managed to sort this with the help from colleagues at work, basically it involves using the same expression used for the current sales and replacing sales with MonthYear and adding max to the start rather than sum and works like a charm.
Message was edited by: shay.cooper Added an example of the graph with sample data please excuse percentage change as the data was created using rand function so make no sense really
- « Previous Replies
-
- 1
- 2
- Next Replies »
Accepted Solutions
- Mark as New
- Bookmark
- Subscribe
- Mute
- Subscribe to RSS Feed
- Permalink
- Report Inappropriate Content
I have managed to sort this with the help from colleagues at work, basically it involves using the same expression used for the current sales and replacing sales with MonthYear and adding max to the start rather than sum and works like a charm.
- Mark as New
- Bookmark
- Subscribe
- Mute
- Subscribe to RSS Feed
- Permalink
- Report Inappropriate Content
Hi!
Could you please attach the example of the solution. Sounds good.
BR,
Konstantins
- Mark as New
- Bookmark
- Subscribe
- Mute
- Subscribe to RSS Feed
- Permalink
- Report Inappropriate Content
@Shay.Cooper
Could you paste the solution, sounds really interesting.
Thanks in advance. ![]()
- Mark as New
- Bookmark
- Subscribe
- Mute
- Subscribe to RSS Feed
- Permalink
- Report Inappropriate Content
Hi,
Can you share the solutions? I also desperatly needed this..
Thank you
- Mark as New
- Bookmark
- Subscribe
- Mute
- Subscribe to RSS Feed
- Permalink
- Report Inappropriate Content
I think more easy is to add a drill down for Year & Month ... may b this is useful for all
- Mark as New
- Bookmark
- Subscribe
- Mute
- Subscribe to RSS Feed
- Permalink
- Report Inappropriate Content
I'm trying use the current sales expression, and its not working for me, any ideas why? It is still summing about both current year and last year...
sum({$<"DateType"={'Rolling 28 Days'},"As Of Date"={">=$(=addmonths(monthend(max("As OfDate"))+1,-12)) <=$(=max("As Of Date"))"}>}Cnt)
- Mark as New
- Bookmark
- Subscribe
- Mute
- Subscribe to RSS Feed
- Permalink
- Report Inappropriate Content
Hello AlexYour As Of Date is written as "As OfDate" and also "As Of Date" hence the field names dont match and it wont work.I have alos found a more performant function to do this using variables and the inyeartodate function this allows the user to make selections on a date and the function will only pull through the latest year to date info, I will try and quickly write a solution and add up on here when I get the time.
- Mark as New
- Bookmark
- Subscribe
- Mute
- Subscribe to RSS Feed
- Permalink
- Report Inappropriate Content
Hi Shay,
I"m looking into this again. Thanks for pointing out my error. It's working now.
Is there a way to make this date specific? I've attached what the want in the Powperpoint file.
I'm using this as my dimension. date([As of Date], 'MM/DD').
- Mark as New
- Bookmark
- Subscribe
- Mute
- Subscribe to RSS Feed
- Permalink
- Report Inappropriate Content
Shay, I how did you get your graph to show July then the rest of the months?
This is my calculated dimension. I would like to start with my max "as of date", then show the last 12 months.
=date(makedate(1+(month("As of Date")>7),month("As of Date"),day("As of Date")),'MM/DD')
- « Previous Replies
-
- 1
- 2
- Next Replies »