Unlock a world of possibilities! Login now and discover the exclusive benefits awaiting you.
- Qlik Community
- :
- All Forums
- :
- QlikView App Dev
- :
- Rolling Weekly Total
- Subscribe to RSS Feed
- Mark Topic as New
- Mark Topic as Read
- Float this Topic for Current User
- Bookmark
- Subscribe
- Mute
- Printer Friendly Page
- Mark as New
- Bookmark
- Subscribe
- Mute
- Subscribe to RSS Feed
- Permalink
- Report Inappropriate Content
Rolling Weekly Total
Hello Smart People, I am looking to do a rolling total on a week by week. weekly revenue was derived by grouping by week .
=Aggr(sum(sales),week_of_Year)
I need to generate the expected column result broken down by week. I have used
RangeSum(Above(Total Sum(Aggr(sum(sales),week_of_Year), Rowno() without any luck. please your assistance is highly appreciated.
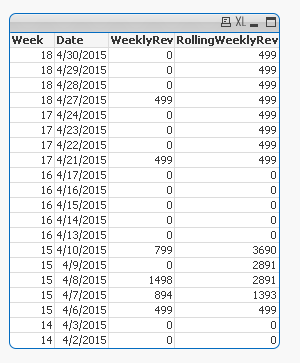
| Year Month | Date | Day of Week | Weekly Rev | Expected Weekly Rolling |
| Apr 2015 | 4/30/2015 | 4 | $0. | $499 |
| Apr 2015 | 4/29/2015 | 3 | $0. | $499 |
| Apr 2015 | 4/28/2015 | 2 | $0. | $499 |
| Apr 2015 | 4/27/2015 | 1 | $499. | $499 |
| Apr 2015 | 4/24/2015 | 4 | $0. | $499 |
| Apr 2015 | 4/23/2015 | 3 | $0. | $499 |
| Apr 2015 | 4/22/2015 | 2 | $0. | $499 |
| Apr 2015 | 4/21/2015 | 1 | $499. | $499 |
| Apr 2015 | 4/17/2015 | 5 | $0. | $0 |
| Apr 2015 | 4/16/2015 | 4 | $0. | $0 |
| Apr 2015 | 4/15/2015 | 3 | $0. | $0 |
| Apr 2015 | 4/14/2015 | 2 | $0. | $0 |
| Apr 2015 | 4/13/2015 | 1 | $0. | $0 |
| Apr 2015 | 4/10/2015 | 5 | $799. | $3,690 |
| Apr 2015 | 4/9/2015 | 4 | $0. | $2,891 |
| Apr 2015 | 4/8/2015 | 3 | $1,498. | $2,891 |
| Apr 2015 | 4/7/2015 | 2 | $894. | $1,393 |
| Apr 2015 | 4/6/2015 | 1 | $499. | $499 |
| Apr 2015 | 4/3/2015 | 2 | $0. | $0 |
| Apr 2015 | 4/2/2015 | 1 | $0. | $0 |
- Mark as New
- Bookmark
- Subscribe
- Mute
- Subscribe to RSS Feed
- Permalink
- Report Inappropriate Content
I figured it out guys--- Here is the code that I was looking for
=RangeSum(below( total Sum(Split_Sales_Amount_Post_Discount), 0, Aggr(RowNo(), Week_Of_Year, Date_ID)))
Thanks
- Mark as New
- Bookmark
- Subscribe
- Mute
- Subscribe to RSS Feed
- Permalink
- Report Inappropriate Content
Is this what you expecting? i Guess so?
- Mark as New
- Bookmark
- Subscribe
- Mute
- Subscribe to RSS Feed
- Permalink
- Report Inappropriate Content
Yes Krishna- Thanks but I have already resolved it. My other question is how to get the percentage of the column [Rolling weekly Rev] the expected result is below as Column [Weekly Rev%]. Thanks
| Rolling Weekly Rev | Weekly Rev% |
| $499. | 0.00% |
| $499. | 20.79% |
| $499. | 31.19% |
| $499. | 62.38% |
| $499. | 15.59% |
| $499. | 20.79% |
| $499. | 31.19% |
| $499. | 62.38% |
| $0. | 0.00% |
| $0. | 0.00% |
| $0. | 0.00% |
| $0. | 0.00% |
| $0. | 0.00% |
| $3,690. | 92.25% |
| $2,891. | 90.34% |
| $2,891. | 100.00% |
| $1,393. | 87.06% |
| $499. | 62.38% |
| $0. | 0.00% |
| $0. | 0.00% |