Unlock a world of possibilities! Login now and discover the exclusive benefits awaiting you.
- Qlik Community
- :
- All Forums
- :
- QlikView App Dev
- :
- Rolling calculation
- Subscribe to RSS Feed
- Mark Topic as New
- Mark Topic as Read
- Float this Topic for Current User
- Bookmark
- Subscribe
- Mute
- Printer Friendly Page
- Mark as New
- Bookmark
- Subscribe
- Mute
- Subscribe to RSS Feed
- Permalink
- Report Inappropriate Content
Rolling calculation
Hey,
I would like to calculate a twelve month rolling chart which is independend from it's time dimension.
Dimensions:
- period_year contains the combination of the month and the year formated as date ("MM.YYYY").
Variables:
- v_mr_top_limit = 07.2015
- v_mr_bottom_limit = 06.2014
Expression:
=SUM(
{<
period_year={'<$(v_mr_top_limit)>$(v_mr_bottom_limit)'}
>} AGGR(
RANGESUM(
ABOVE(
TOTAL SUM(
{<
period_year
>} values
)
,
0
,
12
)
)
,
period_year
)
)
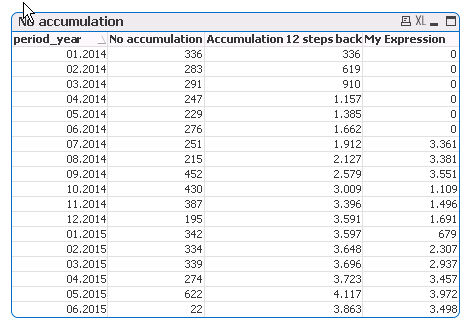
I have expected to see the same value as if I have used the internal chart accumulation function.
I have no idea what causes the problem.
Any suggestions?
Best
Simon
Accepted Solutions
- Mark as New
- Bookmark
- Subscribe
- Mute
- Subscribe to RSS Feed
- Permalink
- Report Inappropriate Content
I think I have solved the problem on my own 
The reason for incorrect calculation is the sort order AGGR() uses because it does not use the current sort order from the chart but the original load order.
In my example this sort order is 2015.1, 2015.10, 2015.11, 2015.12, 2015.2,... etc.
To solve this problem I have done a pre-calculation of the dates and insert my data with a left join.
LET v_month_difference = 18;
LET v_period_year_min = (MAKEDATE(2014,1,1);
FOR i=0 TO ($(v_month_difference)-1)
FACTDATA:
LOAD
$(i)+1 AS sort
,DATE(ADDMONTHS($(v_period_year_min),$(i)),'MM.YYYY') AS period_year
AUTOGENERATE(1)
;
NEXT i;
- Mark as New
- Bookmark
- Subscribe
- Mute
- Subscribe to RSS Feed
- Permalink
- Report Inappropriate Content
I think I have solved the problem on my own
The reason for incorrect calculation is the sort order AGGR() uses because it does not use the current sort order from the chart but the original load order.
In my example this sort order is 2015.1, 2015.10, 2015.11, 2015.12, 2015.2,... etc.
To solve this problem I have done a pre-calculation of the dates and insert my data with a left join.
LET v_month_difference = 18;
LET v_period_year_min = (MAKEDATE(2014,1,1);
FOR i=0 TO ($(v_month_difference)-1)
FACTDATA:
LOAD
$(i)+1 AS sort
,DATE(ADDMONTHS($(v_period_year_min),$(i)),'MM.YYYY') AS period_year
AUTOGENERATE(1)
;
NEXT i;