Unlock a world of possibilities! Login now and discover the exclusive benefits awaiting you.
- Qlik Community
- :
- All Forums
- :
- QlikView App Dev
- :
- Running Total Calculation
- Subscribe to RSS Feed
- Mark Topic as New
- Mark Topic as Read
- Float this Topic for Current User
- Bookmark
- Subscribe
- Mute
- Printer Friendly Page
- Mark as New
- Bookmark
- Subscribe
- Mute
- Subscribe to RSS Feed
- Permalink
- Report Inappropriate Content
Running Total Calculation
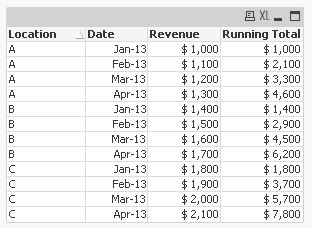
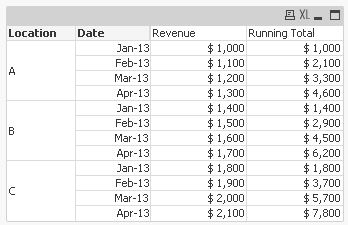
I need to calculate a running total in my script. My data set looks like the first 3 columns of this table:
| Location | Date | Revenue | Running Total |
| A | Jan-13 | $ 1,000 | $ 1,000 |
| A | Feb-13 | $ 1,100 | $ 2,100 |
| A | Mar-13 | $ 1,200 | $ 3,300 |
| A | Apr-13 | $ 1,300 | $ 4,600 |
| B | Jan-13 | $ 1,400 | $ 1,400 |
| B | Feb-13 | $ 1,500 | $ 2,900 |
| B | Mar-13 | $ 1,600 | $ 4,500 |
| B | Apr-13 | $ 1,700 | $ 6,200 |
| C | Jan-13 | $ 1,800 | $ 1,800 |
| C | Feb-13 | $ 1,900 | $ 3,700 |
| C | Mar-13 | $ 2,000 | $ 5,700 |
| C | Apr-13 | $ 2,100 | $ 7,800 |
I want to calculate the fourth column - a running total of Revenue grouped by column 'Location'. Any ideas ? I'm going to be using this in a pivot table on the front end.
- « Previous Replies
-
- 1
- 2
- Next Replies »
Accepted Solutions
- Mark as New
- Bookmark
- Subscribe
- Mute
- Subscribe to RSS Feed
- Permalink
- Report Inappropriate Content
Hi,
or given a table
tab1:
LOAD Location,
     Date#(Date, 'MMM-YY') as Date,
     Num#(Revenue, '$ 0,000') as Revenue
FROM [http://community.qlik.com/thread/121052] (html, codepage is 1252, embedded labels, table is @1);
by joining the Running Total column like:
Left Join (tab1)
LOAD Location,
     Date,
     Num(If(Location=Peek(Location), Revenue+Peek([Running Total]), Revenue), '$ 0,000') as [Running Total]
Resident tab1
Order By Location, Date;

hope this helps
regards
Marco
- Mark as New
- Bookmark
- Subscribe
- Mute
- Subscribe to RSS Feed
- Permalink
- Report Inappropriate Content
Temp:
Load
Location,
Date#(Date,'MMM-YY') as Date,
Revenue
Inline
[
Location, Date, Revenue
A, Jan-13, 1000
A, Feb-13, 1100
A, Mar-13, 1200
A, Apr-13, 1300
B, Jan-13, 1400
B, Feb-13, 1500
B, Mar-13, 1600
B, Apr-13, 1700
C, Jan-13, 1800
C, Feb-13, 1900
C, Mar-13, 2000
C, Apr-13, 2100
];
Final:
Load
Location,
Date,
Revenue,
If(Location = Previous(Location), RangeSum(Revenue + Peek('Running Total')), Revenue) as [Running Total]
Resident Temp
Order By Location, Date;
Drop Table Temp;
- Mark as New
- Bookmark
- Subscribe
- Mute
- Subscribe to RSS Feed
- Permalink
- Report Inappropriate Content
You can try this way also
tmp:
LOAD *,if(Location = Previous(Location), (Revenue + Peek(Running_Total)),Revenue) as Running_Total;
LOAD * Inline
[
Location,Date,Revenue
A, Jan-13, $1000
A, Feb-13, $1100
A, Mar-13, $1200
A, Apr-13, $1300
B, Jan-13, $1400
B, Feb-13, $1500
B, Mar-13, $1600
B, Apr-13, $1700
C, Jan-13, $1800
C, Feb-13, $1900
C, Mar-13, $2000
C, Apr-13, $2100
];
New:
LOAD
Location,Date,Revenue,Running_Total
Resident tmp
Order By Location, Date;
DROP Table tmp;
- Mark as New
- Bookmark
- Subscribe
- Mute
- Subscribe to RSS Feed
- Permalink
- Report Inappropriate Content
Hi,
or given a table
tab1:
LOAD Location,
     Date#(Date, 'MMM-YY') as Date,
     Num#(Revenue, '$ 0,000') as Revenue
FROM [http://community.qlik.com/thread/121052] (html, codepage is 1252, embedded labels, table is @1);
by joining the Running Total column like:
Left Join (tab1)
LOAD Location,
     Date,
     Num(If(Location=Peek(Location), Revenue+Peek([Running Total]), Revenue), '$ 0,000') as [Running Total]
Resident tab1
Order By Location, Date;

hope this helps
regards
Marco
- Mark as New
- Bookmark
- Subscribe
- Mute
- Subscribe to RSS Feed
- Permalink
- Report Inappropriate Content
or at front end
=Num(RangeSum(Above(Revenue,0,RowNo())), '$ 0,000')

regards
Marco
- Mark as New
- Bookmark
- Subscribe
- Mute
- Subscribe to RSS Feed
- Permalink
- Report Inappropriate Content
Manish - your solution works fine for the same data set I published. Unfortunately, I could not get it to work on the actual data set. Attached is an actual set of my data. I think the dates are the problem. My data set has dates in the MM/01/YYYY format not the MMM-YY like in the example. Each record is a sum of revenues for the month so the data is represented as the first day of each month (02/01/2014, 03/01/2014 for example).
Here is my script:
RuningTotalTemp:
LOAD Location,
Date,
Revenue
FROM
XXXXXX
(ooxml, embedded labels, table is Sheet1)
;
RunningTotal:
Load
Location,
Date,
Revenue,
If (Location = Previous(Location), RangeSum(Revenue + Peek('Running Total')), Revenue) as RunningTotal
Resident RuningTotalTemp
Order by Location, Date
;
Drop Table RuningTotalTemp
;
- Mark as New
- Bookmark
- Subscribe
- Mute
- Subscribe to RSS Feed
- Permalink
- Report Inappropriate Content
Hello Marco:
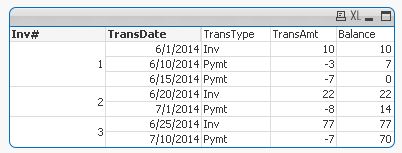
I think your last post on this topic is close to what I want but I am having trouble still. I have a simple accumulation problem in calculating a balance per the following Excel Input:
| Inv# | TransDate | TransType | TransAmt |
| 1 | 6/1/2014 | Inv | 10 |
| 2 | 6/20/2014 | Inv | 22 |
| 3 | 6/25/2014 | Inv | 77 |
| 1 | 6/10/2014 | Pymt | -3 |
| 1 | 6/15/2014 | Pymt | -7 |
| 2 | 7/1/2014 | Pymt | -8 |
| 3 | 7/10/2014 | Pymt | -7 |
So I would like to create a Straight Table showing the calculated balance per invoice.
Inv# TransDate TransType TransAmt Balance
1 6/1/2014 Inv 10 10
1 6/10/2014 Pymt -3 7
1 6/15/2014 Pymt -7 0
2 6/20/2014 Inv 22 22
2 7/1/2014 Pymt -8 14
In your last post, you have the expression: =Num(RangeSum(Above(Revenue,0,RowNo())), '$ 0,000')
Because the example given in the original post uses an "In-Line Table", the 'Above' term in your post creates an error in my script. Can you redo your example to show the syntax for the Excel File content I describe.
Thanks
David
- Mark as New
- Bookmark
- Subscribe
- Mute
- Subscribe to RSS Feed
- Permalink
- Report Inappropriate Content
I tried to change the example to a Excel data source with the field names and data you provided:

The balance expression now is defined as:
=RangeSum(Above(TransAmt,0,RowNo()))
hope this helps
regards
Marco
- Mark as New
- Bookmark
- Subscribe
- Mute
- Subscribe to RSS Feed
- Permalink
- Report Inappropriate Content
Temp:
Load
Location,
Date#(Date,'DD/MM/YYYY') as Date, // JUST ONE CHANGE
Revenue
Inline
[
Location, Date, Revenue
A, Jan-13, 1000
A, Feb-13, 1100
A, Mar-13, 1200
A, Apr-13, 1300
B, Jan-13, 1400
B, Feb-13, 1500
B, Mar-13, 1600
B, Apr-13, 1700
C, Jan-13, 1800
C, Feb-13, 1900
C, Mar-13, 2000
C, Apr-13, 2100
];
Final:
Load
Location,
Date,
Revenue,
If(Location = Previous(Location), RangeSum(Revenue + Peek('Running Total')), Revenue) as [Running Total]
Resident Temp
Order By Location, Date;
Drop Table Temp;
- Mark as New
- Bookmark
- Subscribe
- Mute
- Subscribe to RSS Feed
- Permalink
- Report Inappropriate Content
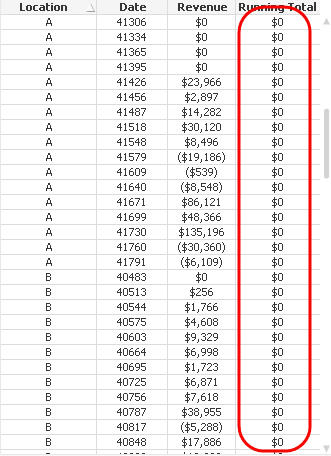
This did not work with my attached Excel data set.
Here are the results:

- « Previous Replies
-
- 1
- 2
- Next Replies »