Unlock a world of possibilities! Login now and discover the exclusive benefits awaiting you.
- Qlik Community
- :
- All Forums
- :
- QlikView App Dev
- :
- Ruuning Average Issue
- Subscribe to RSS Feed
- Mark Topic as New
- Mark Topic as Read
- Float this Topic for Current User
- Bookmark
- Subscribe
- Mute
- Printer Friendly Page
- Mark as New
- Bookmark
- Subscribe
- Mute
- Subscribe to RSS Feed
- Permalink
- Report Inappropriate Content
Ruuning Average Issue
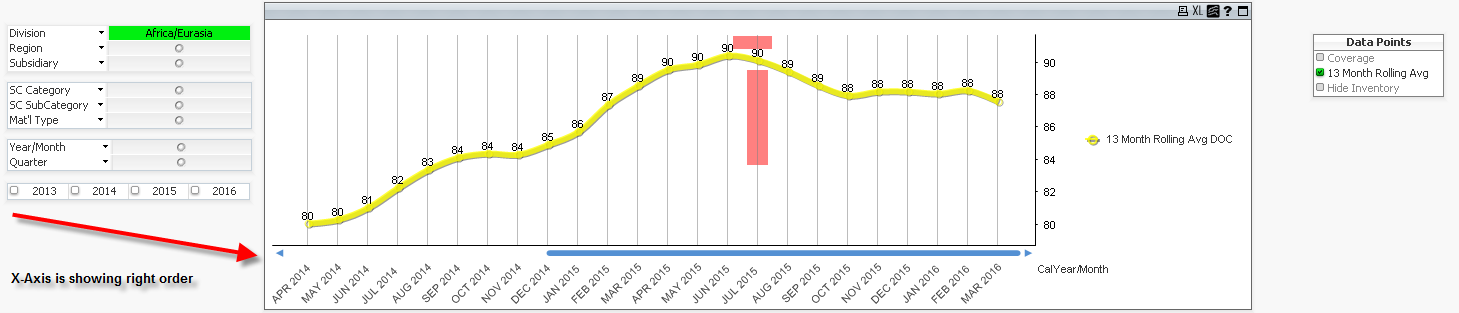
I have qvw that has chart which shown running average of last 13 month. Soon I pick a year in selection, I expect running average should still be intact but only that years shows up with values. Somehow X-Axis shows weird order and latest months show up in between which messes up running average as well.. Please see qvw attached and screenshot with no selections and with selection
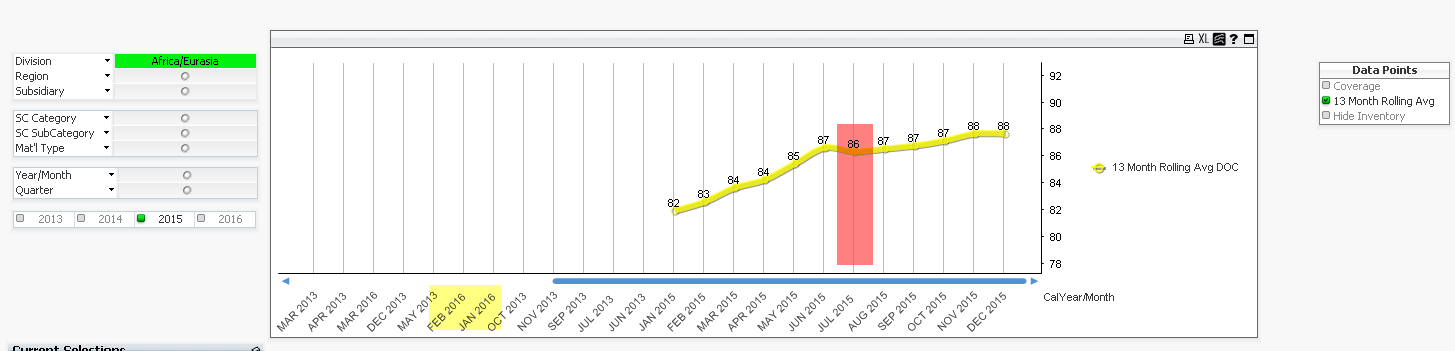
Now When I select Year 2015, It brings wrong order in x-Axis as shown below which messes up running average. PLEASE HELP
Accepted Solutions
- Mark as New
- Bookmark
- Subscribe
- Mute
- Subscribe to RSS Feed
- Permalink
- Report Inappropriate Content
If you want to see only the selected period then wrap the unaggregated strings in the five info expressions in an Only() function:
old: ='CalYear/Month = '&[CalYear/Month]
new: =Only('CalYear/Month = ') &[CalYear/Month]
Your CalYear/Month field contains only text values. Those cannot be sorted numerically. You can sort by an expression like only({1}CalKey). Or better create CalYear/Month as a dual field: Date(MonthStart(MyDate),'MMM YYYY') as [CalYear/Month]
See attached qvw.
talk is cheap, supply exceeds demand
- Mark as New
- Bookmark
- Subscribe
- Mute
- Subscribe to RSS Feed
- Permalink
- Report Inappropriate Content
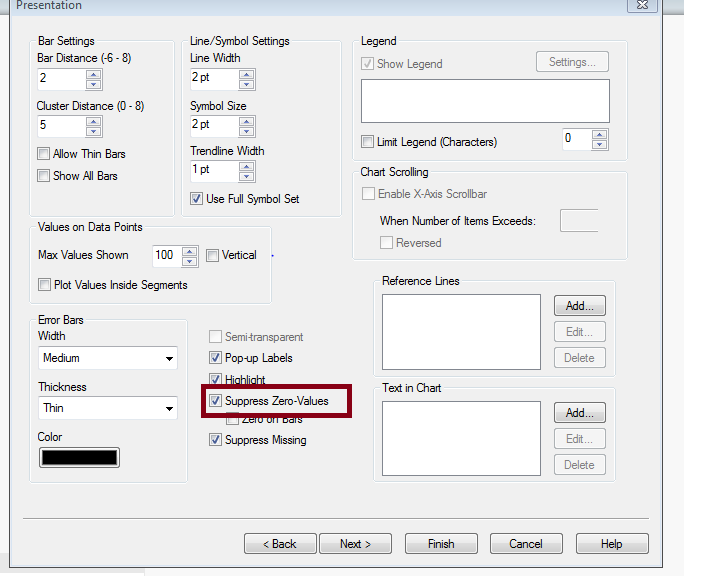
do you need only 2015 years data , then remaining all zero values are suppressed .
like below
- Mark as New
- Bookmark
- Subscribe
- Mute
- Subscribe to RSS Feed
- Permalink
- Report Inappropriate Content
Faisal either supress zero or missing (nulls) else assign zero to nulls or missing.
- Mark as New
- Bookmark
- Subscribe
- Mute
- Subscribe to RSS Feed
- Permalink
- Report Inappropriate Content
If you want to see only the selected period then wrap the unaggregated strings in the five info expressions in an Only() function:
old: ='CalYear/Month = '&[CalYear/Month]
new: =Only('CalYear/Month = ') &[CalYear/Month]
Your CalYear/Month field contains only text values. Those cannot be sorted numerically. You can sort by an expression like only({1}CalKey). Or better create CalYear/Month as a dual field: Date(MonthStart(MyDate),'MMM YYYY') as [CalYear/Month]
See attached qvw.
talk is cheap, supply exceeds demand
- Mark as New
- Bookmark
- Subscribe
- Mute
- Subscribe to RSS Feed
- Permalink
- Report Inappropriate Content
Thanks.. It seems they are sorted properly and also running average for 36 months is calculated correctly. I wanted to know how this work. Why info expressions were messing up running calculations and order in X-Axis