Unlock a world of possibilities! Login now and discover the exclusive benefits awaiting you.
- Qlik Community
- :
- All Forums
- :
- QlikView App Dev
- :
- SVG map
- Subscribe to RSS Feed
- Mark Topic as New
- Mark Topic as Read
- Float this Topic for Current User
- Bookmark
- Subscribe
- Mute
- Printer Friendly Page
- Mark as New
- Bookmark
- Subscribe
- Mute
- Subscribe to RSS Feed
- Permalink
- Report Inappropriate Content
SVG map
hi
i downloaded and installed svg map extension
i have two question:
1- i can find my country svg map and i want to know how can i added new map to this extension
2- how can i use this extension in my qlikview dashboard
if u can please send me an example
thank you
- Tags:
- qlikview map
- svg map
Accepted Solutions
- Mark as New
- Bookmark
- Subscribe
- Mute
- Subscribe to RSS Feed
- Permalink
- Report Inappropriate Content
i found my answer 
you can download svg map extension from blow link :
in default mode it has 48 country and if you want to add some new country map you can download it from some site like blow:
https://www.amcharts.com/svg-maps/
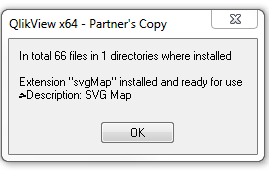
after download the extension and your map you should double click on svgmap.qar
after this action you will see this message:
the next step is add your new map:
go to bow address:
C:\Users\(Current user)\AppData\Local\QlikTech\QlikView\Extensions\Objects\svgMap
and paste your new map
attention that your file must be svg file
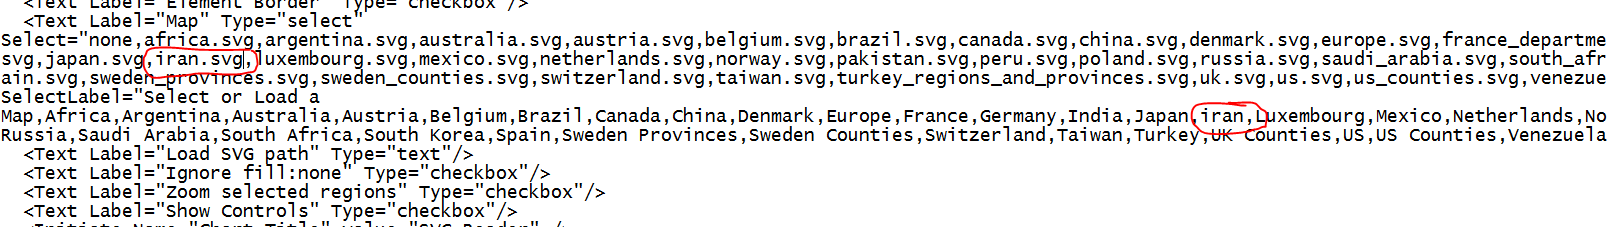
in above path you will see a file taht its name is {definition.xml}
open it with notepad and add your svg file name to it
you should add it in two place like blow picture:
after this you need your data
if you open your svg file with something like notepad you can find id of each state
your data source should have this id.
in next step you can create your dashboard
you should turn on your web view and add new sheet
select extension then add svg map
right click on svg map then select state filed on region id
your state id is id field on svg map
- Mark as New
- Bookmark
- Subscribe
- Mute
- Subscribe to RSS Feed
- Permalink
- Report Inappropriate Content
- Mark as New
- Bookmark
- Subscribe
- Mute
- Subscribe to RSS Feed
- Permalink
- Report Inappropriate Content
i found my answer
you can download svg map extension from blow link :
in default mode it has 48 country and if you want to add some new country map you can download it from some site like blow:
https://www.amcharts.com/svg-maps/
after download the extension and your map you should double click on svgmap.qar
after this action you will see this message:
the next step is add your new map:
go to bow address:
C:\Users\(Current user)\AppData\Local\QlikTech\QlikView\Extensions\Objects\svgMap
and paste your new map
attention that your file must be svg file
in above path you will see a file taht its name is {definition.xml}
open it with notepad and add your svg file name to it
you should add it in two place like blow picture:
after this you need your data
if you open your svg file with something like notepad you can find id of each state
your data source should have this id.
in next step you can create your dashboard
you should turn on your web view and add new sheet
select extension then add svg map
right click on svg map then select state filed on region id
your state id is id field on svg map
- Mark as New
- Bookmark
- Subscribe
- Mute
- Subscribe to RSS Feed
- Permalink
- Report Inappropriate Content
Hi all,
I faced the same problem, and i had created my own SVG already.
However, i cannot find the path C:\Users\(Current user)\AppData\Local\QlikTech\QlikView\Extensions\Objects\svgMap, [I am using Window 7].
Should i create my own path?
I tried to put the svg file in the svg location (somewhere in my computer, but not the above path).
How you guys solve it? Please help. Thanks.
- Mark as New
- Bookmark
- Subscribe
- Mute
- Subscribe to RSS Feed
- Permalink
- Report Inappropriate Content
hi
i create this post in windows 7 too
are you sure you dont have this path?
its a hidden path