Unlock a world of possibilities! Login now and discover the exclusive benefits awaiting you.
- Qlik Community
- :
- All Forums
- :
- QlikView App Dev
- :
- Sales Rep Format
- Subscribe to RSS Feed
- Mark Topic as New
- Mark Topic as Read
- Float this Topic for Current User
- Bookmark
- Subscribe
- Mute
- Printer Friendly Page
- Mark as New
- Bookmark
- Subscribe
- Mute
- Subscribe to RSS Feed
- Permalink
- Report Inappropriate Content
Sales Rep Format
I have some data relating to Sales Reps in table in Oracle.
Data in Orcle Table | ||||
Dept | Customer | Type | Traget | Achievement |
West | A | CREDIT | 1000 | 800 |
West | A | CASH | 500 | 400 |
West | A | COMM | 250 | 200 |
West | A | PAID | 100 | 80 |
West | B | CREDIT | 4000 | 3200 |
West | B | CASH | 3000 | 2500 |
West | B | COMM | 2000 | 1500 |
West | B | PAID | 1000 | 750 |
West | C | CASH | 3000 | 2400 |
North | D | CREDIT | 6000 | 4800 |
North | D | CASH | 3000 | 2400 |
North | D | COMM | 2500 | 2000 |
North | D | PAID | 1000 | 800 |
North | E | CREDIT | 4000 | 3200 |
North | E | CASH | 3000 | 2400 |
North | E | COMM | 2000 | 1600 |
North | E | PAID | 1000 | 800 |
South | F | CREDIT | 1000 | 800 |
South | F | CASH | 500 | 400 |
South | F | COMM | 250 | 200 |
South | F | PAID | 100 | 90 |
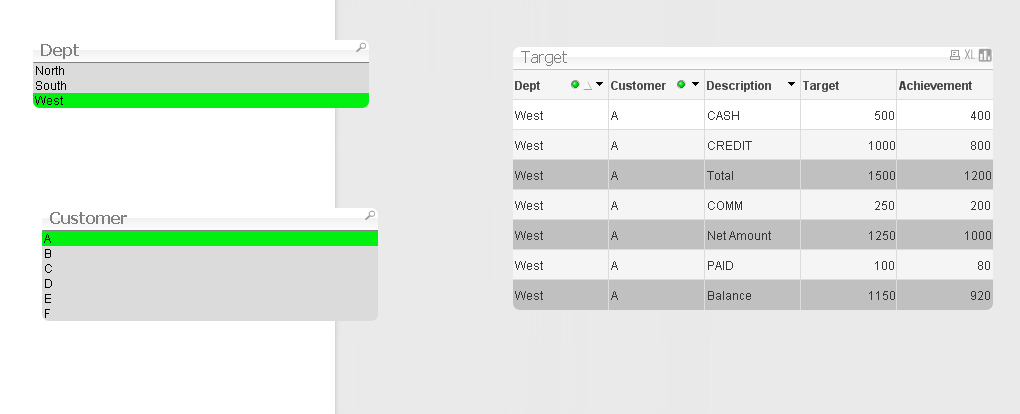
I want to load this data into a QV data model and prepare a report as shown in the attached excel sheet. I find it difficult figure out how design the report specially with rows highlighted in Yellow color.
Kindly help with a sample QV documents
Output Report format Required | |||||
Dept | Customer | Description | Target | Achievement | |
West | A | Cash | 1000 | 800 | |
West | A | CREDIT | 500 | 400 | |
West | A | TOTAL | 1500 | 1200 | |
West | A | COMM | 250 | 200 | |
West | A | NET AMOUNT | 1250 | 1000 | |
West | A | PAID | 1000 | 750 | |
West | A | BALANCE | 250 | 250 | |
West | B | Cash | 4000 | 3200 | |
West | B | CREDIT | 3000 | 2500 | |
West | B | TOTAL | 7000 | 5700 | |
West | B | COMM | 2000 | 1500 | |
West | B | NET AMOUNT | 5000 | 4200 | |
West | B | PAID | 1000 | 800 | |
West | B | BALANCE | 4000 | 3400 | |
Accepted Solutions
- Mark as New
- Bookmark
- Subscribe
- Mute
- Subscribe to RSS Feed
- Permalink
- Report Inappropriate Content
I am using qliks associative engine to do the bucketting of types into a running tally.
To do this I created a lookup table in 2 stages. The first just reads all the unique types from the data and stores the value as type and description.I add a multiplier that I use later to tell qlik if the row should be added or subtracted from the running tally. And I also assign an order to which the rows should be sorted and presented.
The next stage is the trick. Here for each subtotal tally (total, net amount, paid) I map the subtotal to the preceding types. For total it's cash and credit. For net amount its cash and credit and comm etc...
Then I use description as the dimension I'm the chart so that it will show the types and the subtotal values (total etc..) in one list, and when it sums target for a subtotal all links on the associated preceding types and Theor multipliers to create a value.
Background colors are calculated on the dimension and expression properties.
Does that help?
- Mark as New
- Bookmark
- Subscribe
- Mute
- Subscribe to RSS Feed
- Permalink
- Report Inappropriate Content
Hi Create Pivot Table
Dimension:
Dept
Customer
Type
Expression:
=sum(target)
=sum(Achievement)
Click ok.
Go to chart properties --> Presentation tab --> Select Type --> Click on show partial sum.
Regards
ASHFAQ
- Mark as New
- Bookmark
- Subscribe
- Mute
- Subscribe to RSS Feed
- Permalink
- Report Inappropriate Content
IT WONT WORK
- Mark as New
- Bookmark
- Subscribe
- Mute
- Subscribe to RSS Feed
- Permalink
- Report Inappropriate Content
A little rough but workable.
- Mark as New
- Bookmark
- Subscribe
- Mute
- Subscribe to RSS Feed
- Permalink
- Report Inappropriate Content
Thanks Jonathan for your great effort. But I find it difficult to understand your script and expression. I appreciate If you can explain it in detail
Thanks
- Mark as New
- Bookmark
- Subscribe
- Mute
- Subscribe to RSS Feed
- Permalink
- Report Inappropriate Content
I am using qliks associative engine to do the bucketting of types into a running tally.
To do this I created a lookup table in 2 stages. The first just reads all the unique types from the data and stores the value as type and description.I add a multiplier that I use later to tell qlik if the row should be added or subtracted from the running tally. And I also assign an order to which the rows should be sorted and presented.
The next stage is the trick. Here for each subtotal tally (total, net amount, paid) I map the subtotal to the preceding types. For total it's cash and credit. For net amount its cash and credit and comm etc...
Then I use description as the dimension I'm the chart so that it will show the types and the subtotal values (total etc..) in one list, and when it sums target for a subtotal all links on the associated preceding types and Theor multipliers to create a value.
Background colors are calculated on the dimension and expression properties.
Does that help?
- Mark as New
- Bookmark
- Subscribe
- Mute
- Subscribe to RSS Feed
- Permalink
- Report Inappropriate Content
Thanks a lot for your explanation though a bit difficult for me understand. I will try my best get this applied my data model. Thanks one again