Unlock a world of possibilities! Login now and discover the exclusive benefits awaiting you.
- Qlik Community
- :
- All Forums
- :
- QlikView App Dev
- :
- Scatter Chart Google Map Plotting Error
Options
- Subscribe to RSS Feed
- Mark Topic as New
- Mark Topic as Read
- Float this Topic for Current User
- Bookmark
- Subscribe
- Mute
- Printer Friendly Page
Turn on suggestions
Auto-suggest helps you quickly narrow down your search results by suggesting possible matches as you type.
Showing results for
Not applicable
2015-11-26
02:33 AM
- Mark as New
- Bookmark
- Subscribe
- Mute
- Subscribe to RSS Feed
- Permalink
- Report Inappropriate Content
Scatter Chart Google Map Plotting Error
Hi,
I'm trying to plot Data on a map using scatter chart in qlikview.
Gone through many documentations, examples and qvw files from forums.
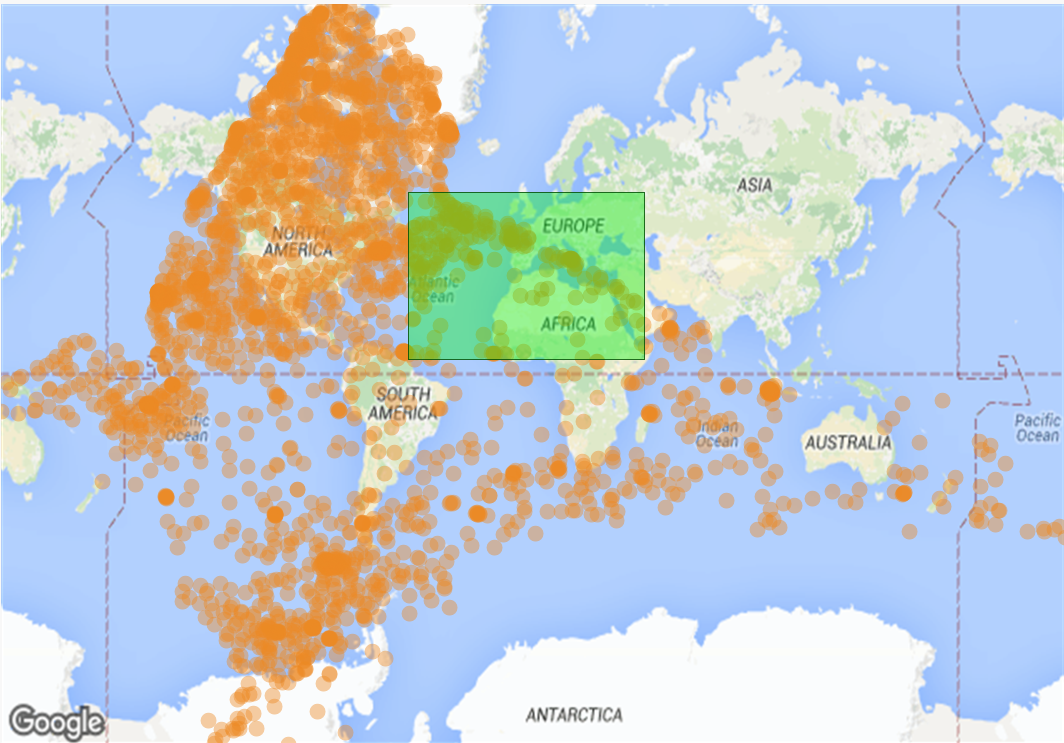
the issue is, its plotting my data on all over the world map rather than the country to which the data belongs.
Zooming in, the map isn't zooming, only the data plots are zooming.
Background is still.
I referred to this Demo qvw for Scatter chart Map : Qlik Demos: See QlikView in Action | Demo.Qlik.Com
Any suggestions would be really helpful

899 Views
1 Reply
Creator III
2015-11-26
05:31 AM
- Mark as New
- Bookmark
- Subscribe
- Mute
- Subscribe to RSS Feed
- Permalink
- Report Inappropriate Content
There can be problems with variable, with the data points... see this post and compare your graph with them
611 Views