Unlock a world of possibilities! Login now and discover the exclusive benefits awaiting you.
- Qlik Community
- :
- All Forums
- :
- QlikView
- :
- Scatter Chart Map
- Subscribe to RSS Feed
- Mark Topic as New
- Mark Topic as Read
- Float this Topic for Current User
- Bookmark
- Subscribe
- Mute
- Printer Friendly Page
- Mark as New
- Bookmark
- Subscribe
- Mute
- Subscribe to RSS Feed
- Permalink
- Report Inappropriate Content
Scatter Chart Map
Hello,
I have a Scatter Chart as a Map (see attached QVW).
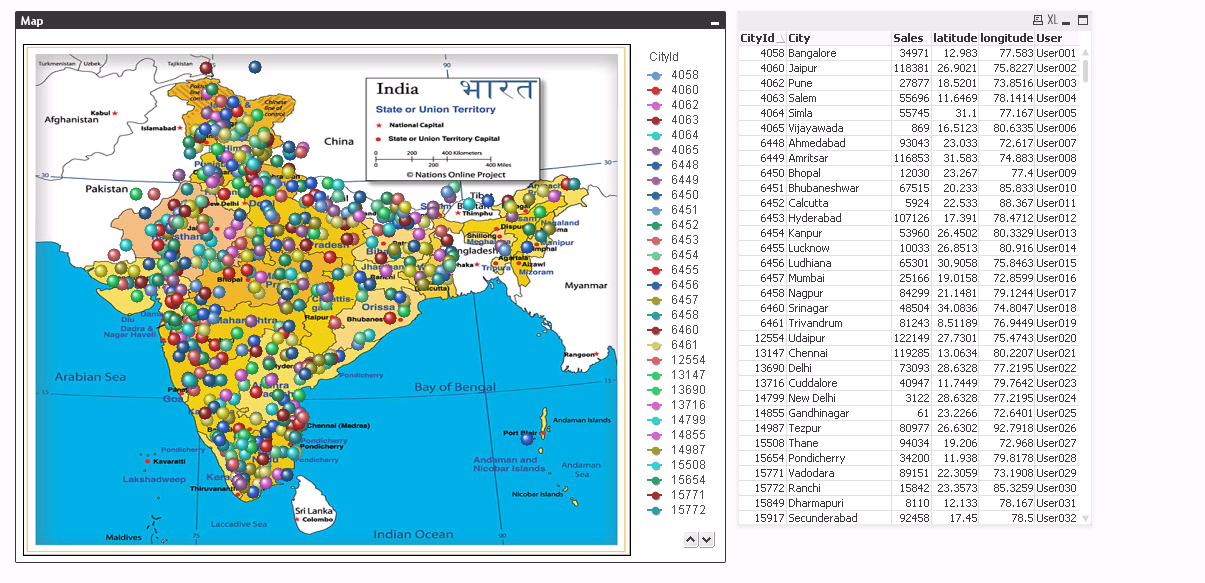
The thing is I need the following: I don't want to see all city bubbles on the first place. I need to show only the corresponding bubble for the user who logs in, by using function OsUser() where in my company I get UserXXX:
Do you know how to do this? That when I open the app show only the bubble associated to my City?
---
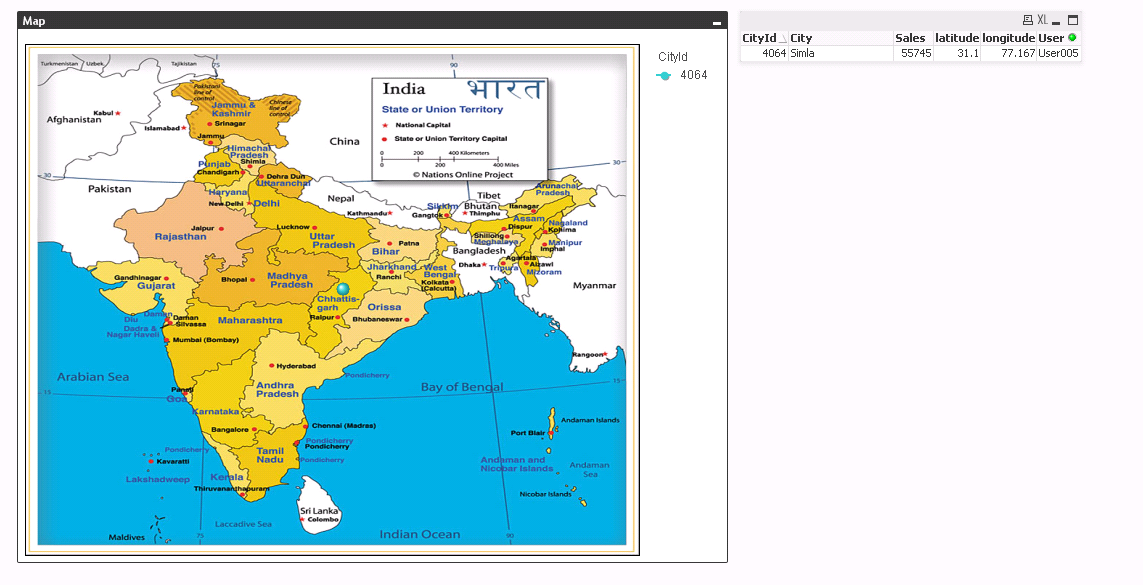
The thing is that I don't want to reduce all the data for a specific City. I need to show all the data for all users.
The only issue I need to solve is with the map. Let's say you're User005. Then when I open the app it should show only the bubble for User005, but still showing the all the data for the rest of the app...
---
Thanks!!!
- Mark as New
- Bookmark
- Subscribe
- Mute
- Subscribe to RSS Feed
- Permalink
- Report Inappropriate Content
maybe a dimension like
if(User = 'User018', CityId)
replace 'User018' with OSUser()
- Mark as New
- Bookmark
- Subscribe
- Mute
- Subscribe to RSS Feed
- Permalink
- Report Inappropriate Content
You can add set analysis to each of your expressions on the map to only show the data for the user.
For example,
Longitude:
=SUM({<User={$(=OSUser())}>} round (256*pow(2,($(var_zoom)-1)))+( longitude *((256*pow(2,$(var_zoom)))/360)) )
Latitude:
=SUM({<User={$(=OSUser())}>} ((256*pow(2,($(var_zoom)-1)))+((0.5*log((1+(sin((latitude)*pi()/180)))/(1-(sin((latitude)*pi()/180)))))*((-256*pow(2,$(var_zoom)))/(2*pi())))))