Unlock a world of possibilities! Login now and discover the exclusive benefits awaiting you.
Announcements
April 13–15 - Dare to Unleash a New Professional You at Qlik Connect 2026: Register Now!
- Qlik Community
- :
- All Forums
- :
- QlikView App Dev
- :
- Scatter chart data representation
Options
- Subscribe to RSS Feed
- Mark Topic as New
- Mark Topic as Read
- Float this Topic for Current User
- Bookmark
- Subscribe
- Mute
- Printer Friendly Page
Turn on suggestions
Auto-suggest helps you quickly narrow down your search results by suggesting possible matches as you type.
Showing results for
Not applicable
2014-01-20
04:54 AM
- Mark as New
- Bookmark
- Subscribe
- Mute
- Subscribe to RSS Feed
- Permalink
- Report Inappropriate Content
Scatter chart data representation
Hi guys,
I have a question, is is possible to have two different types of data representation on a single scatter chart?
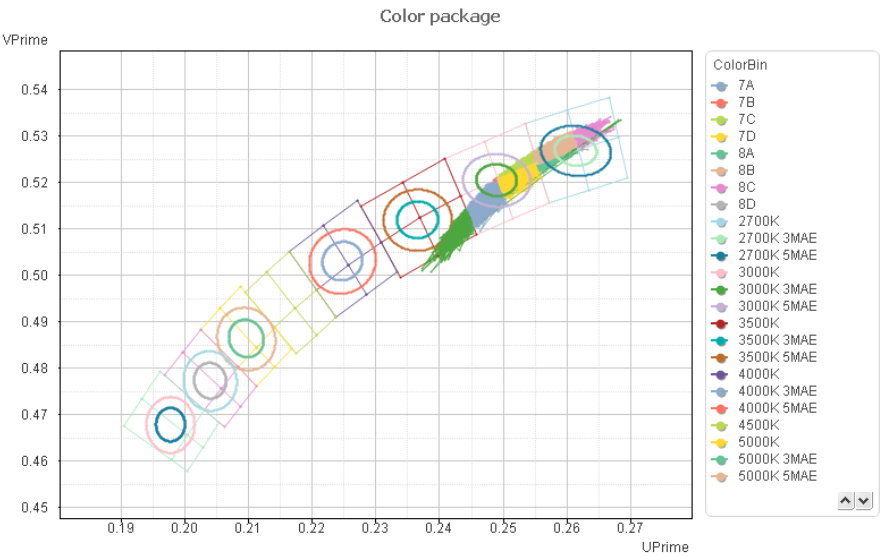
If you look at the scatter chart below, the data is represented as "Both lines and symbols". Now what I intended is that, the rectangular and circular representation as lines is fine as it is but it would be nice (also another of my boss's requirement  ) that the data plotted in between them (rectangles and circles, denoted as data 7A to 8B) is represented as symbols.
Appreciate any suggestions/insights/opinions on this matter. Thank you very much guys for your kind attention. 
0 Replies