Unlock a world of possibilities! Login now and discover the exclusive benefits awaiting you.
- Qlik Community
- :
- All Forums
- :
- QlikView App Dev
- :
- Scatter chart
Options
- Subscribe to RSS Feed
- Mark Topic as New
- Mark Topic as Read
- Float this Topic for Current User
- Bookmark
- Subscribe
- Mute
- Printer Friendly Page
Turn on suggestions
Auto-suggest helps you quickly narrow down your search results by suggesting possible matches as you type.
Showing results for
Not applicable
2014-04-28
09:40 AM
- Mark as New
- Bookmark
- Subscribe
- Mute
- Subscribe to RSS Feed
- Permalink
- Report Inappropriate Content
Scatter chart
Hi, all i have simple dough in a scatter chat how the bubbles will increase i mean based on wich axis it will increase (based on X or Y),Please reply
- Tags:
- new_to_qlikview
678 Views
6 Replies
MVP
2014-04-28
09:44 AM
- Mark as New
- Bookmark
- Subscribe
- Mute
- Subscribe to RSS Feed
- Permalink
- Report Inappropriate Content
Go to presentation tab
Representation
Max Bubble Size : Change here
602 Views
Champion III
2014-04-28
09:44 AM
- Mark as New
- Bookmark
- Subscribe
- Mute
- Subscribe to RSS Feed
- Permalink
- Report Inappropriate Content
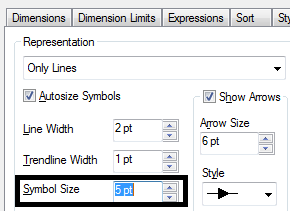
Y - axis and also you can increase the bubbles size by
Properties >> Presentation >> Representation >> Symbol Size (Increase the here)
Not applicable
2014-04-28
09:47 AM
Author
- Mark as New
- Bookmark
- Subscribe
- Mute
- Subscribe to RSS Feed
- Permalink
- Report Inappropriate Content
Thanks
602 Views
Champion III
2014-04-28
09:48 AM
- Mark as New
- Bookmark
- Subscribe
- Mute
- Subscribe to RSS Feed
- Permalink
- Report Inappropriate Content
Properties >> Presentation >> Representation >> Symbol Size (Increase the here)
You can change from here
602 Views
MVP
2014-04-28
09:49 AM
- Mark as New
- Bookmark
- Subscribe
- Mute
- Subscribe to RSS Feed
- Permalink
- Report Inappropriate Content
I think it is Bubble Size... You need to make sure that Autosize Symbols should be disabled.
602 Views
Champion III
2014-04-28
10:18 AM
- Mark as New
- Bookmark
- Subscribe
- Mute
- Subscribe to RSS Feed
- Permalink
- Report Inappropriate Content
If you got correct answer from thread so mark the thread as correct / helpful for reference.
Regards
602 Views