Unlock a world of possibilities! Login now and discover the exclusive benefits awaiting you.
- Qlik Community
- :
- All Forums
- :
- QlikView App Dev
- :
- Script generated by qlikview
- Subscribe to RSS Feed
- Mark Topic as New
- Mark Topic as Read
- Float this Topic for Current User
- Bookmark
- Subscribe
- Mute
- Printer Friendly Page
- Mark as New
- Bookmark
- Subscribe
- Mute
- Subscribe to RSS Feed
- Permalink
- Report Inappropriate Content
Script generated by qlikview
Hi,
Is there any way we can see the backend script or Algorith generated by qlikview when we run a report ?
Thanks
KS
- Mark as New
- Bookmark
- Subscribe
- Mute
- Subscribe to RSS Feed
- Permalink
- Report Inappropriate Content
No, because there is no script. The algorithms are executed by the chart engine. You cannot 'see' that. The code of the chart engine is the 'secret sauce' that only the Qlik engineers get to look at.
talk is cheap, supply exceeds demand
- Mark as New
- Bookmark
- Subscribe
- Mute
- Subscribe to RSS Feed
- Permalink
- Report Inappropriate Content
Hi
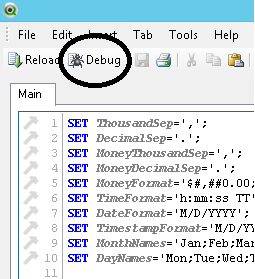
You can't see the Backend Script at the time of Reload.
But you can see the Script at the time Debugging.
See the Snapshot:
Regards
Av7eN
- Mark as New
- Bookmark
- Subscribe
- Mute
- Subscribe to RSS Feed
- Permalink
- Report Inappropriate Content
Thanks for the reply Gysbert, but the question i am asking is to understand how can effectively we can test the created reports ? like in traditional BI, we get to see the backend queries generated when we run a report and can be used for testing if the joins or correct or the formula writen is returning correct results or are there any issues with grouping.
i understand qlikview works on associative model but how can we trust the expressions that we wrote are correct ? and are going to give correct results ? what is the basis for verifying this.
It would be great if you can help me understand this.
Thanks
KS
- Mark as New
- Bookmark
- Subscribe
- Mute
- Subscribe to RSS Feed
- Permalink
- Report Inappropriate Content
That's a good question. The way to verify the correctness of your expressions is testing them. Create test data sets and the accompanying known correct results for that data set that the expressions should return. Load the test set and compare the results of the expressions with your known correct results. Do that for every test data set.
talk is cheap, supply exceeds demand
- Mark as New
- Bookmark
- Subscribe
- Mute
- Subscribe to RSS Feed
- Permalink
- Report Inappropriate Content
Hi,
Am not sure I fully understand what you want, but I think the answer might be to look in the Log file generated when you reload.
Ctlr + Alt + D then check GENERATE LOGFILE.
So once the reload is finished go to where you saved the qvw file you've just reloaded and see the logfile open it and look in there.,
Hopefully this is what you're after
- Mark as New
- Bookmark
- Subscribe
- Mute
- Subscribe to RSS Feed
- Permalink
- Report Inappropriate Content
You can further automate this in a way, by adding a macro to your QVW document that exports the table version of various objects to excel or csv. After loading the test data set and exporting the chart results, load the exports in a QVW that is expressly built for validation purposes. A few well constructed scripts and charts will point out any anomalies.
But the start is always - as Gysbert pointed out - a test data set and a list of expected output values. Make sure that your test data set covers as many areas and situations as possible.