Unlock a world of possibilities! Login now and discover the exclusive benefits awaiting you.
- Qlik Community
- :
- All Forums
- :
- QlikView App Dev
- :
- Segments as legend in Gauge Chart
- Subscribe to RSS Feed
- Mark Topic as New
- Mark Topic as Read
- Float this Topic for Current User
- Bookmark
- Subscribe
- Mute
- Printer Friendly Page
- Mark as New
- Bookmark
- Subscribe
- Mute
- Subscribe to RSS Feed
- Permalink
- Report Inappropriate Content
Segments as legend in Gauge Chart
Dear Experts,
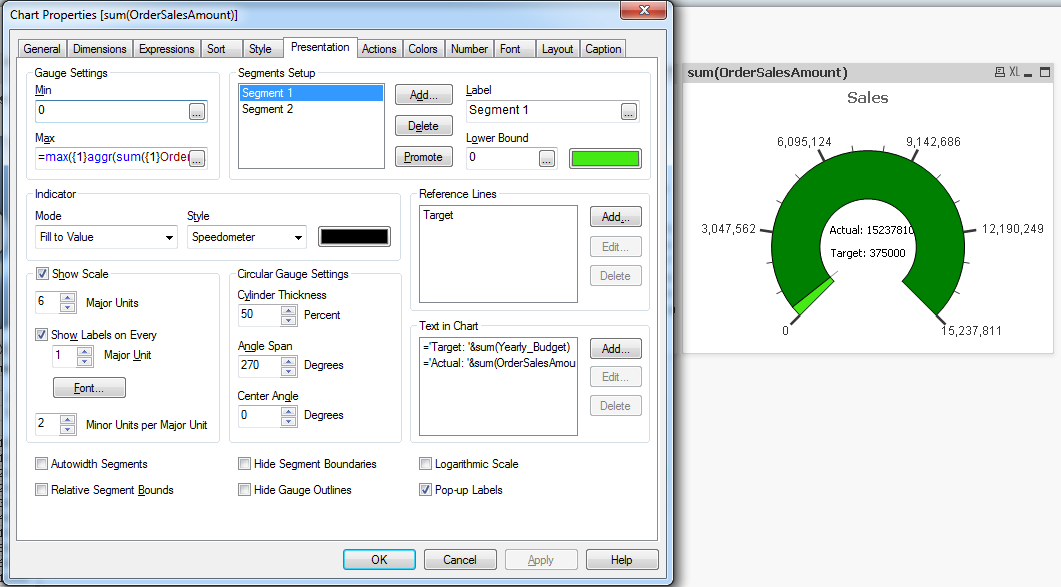
Could you please advise me on how to display the Segments (color, name and value) as legend in the Gauge chart. Attached the Screen chart
- Tags:
- new_to_qlikview
- Mark as New
- Bookmark
- Subscribe
- Mute
- Subscribe to RSS Feed
- Permalink
- Report Inappropriate Content
You can have two text box, each displaying one segment color and value,
I think there is no inbuilt way of doing this as gauge chart does not have any dimension and it basically display only one value.
Although we can tweak it to display more than one value by dynamic segments, but if need legends you need to do it externally using text box....
- Mark as New
- Bookmark
- Subscribe
- Mute
- Subscribe to RSS Feed
- Permalink
- Report Inappropriate Content
I do not think you can.
To display values you may
1) add a textbox overlapping your gauge
2) Modify the title of your expression : ="Your Title : " & YourExpressionusedIntheGauge (perhaps with the num function)
(here I have done both)
To display legend, you need to add textbox with the same colors that will recall the different boundaries. You may add a comment or anything to explain the gauge.
Fabrice
- Mark as New
- Bookmark
- Subscribe
- Mute
- Subscribe to RSS Feed
- Permalink
- Report Inappropriate Content
Thanks Arun. However, displaying it as Text boxes is not agreed by my Technical Team, Hence i am looking for any Other tweaks, if possible.
- Mark as New
- Bookmark
- Subscribe
- Mute
- Subscribe to RSS Feed
- Permalink
- Report Inappropriate Content
Hi,
I have done something like this
(In form of text in chart....)
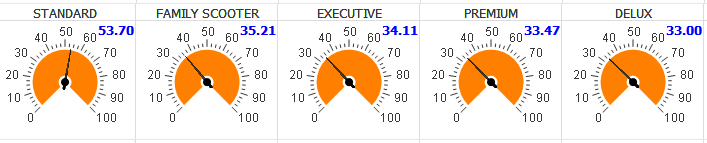
This is pivot table in which each expression is used as gauge chart.....you can experiment it as one gauge chart also....