Unlock a world of possibilities! Login now and discover the exclusive benefits awaiting you.
- Qlik Community
- :
- All Forums
- :
- QlikView App Dev
- :
- Selected Item Will be part of Next Calculation
- Subscribe to RSS Feed
- Mark Topic as New
- Mark Topic as Read
- Float this Topic for Current User
- Bookmark
- Subscribe
- Mute
- Printer Friendly Page
- Mark as New
- Bookmark
- Subscribe
- Mute
- Subscribe to RSS Feed
- Permalink
- Report Inappropriate Content
Selected Item Will be part of Next Calculation
Hi All,
I have a chart which is having a percentage calculation (Blue Line) and two Adjustable Lines (Red Line) by Item Number.
The requirement is like we need to capture Items in two level:
1. All Items present in the chart (Assume no of Items X).
2. The Items present in between two Red Lines (Assume no of Items Y).
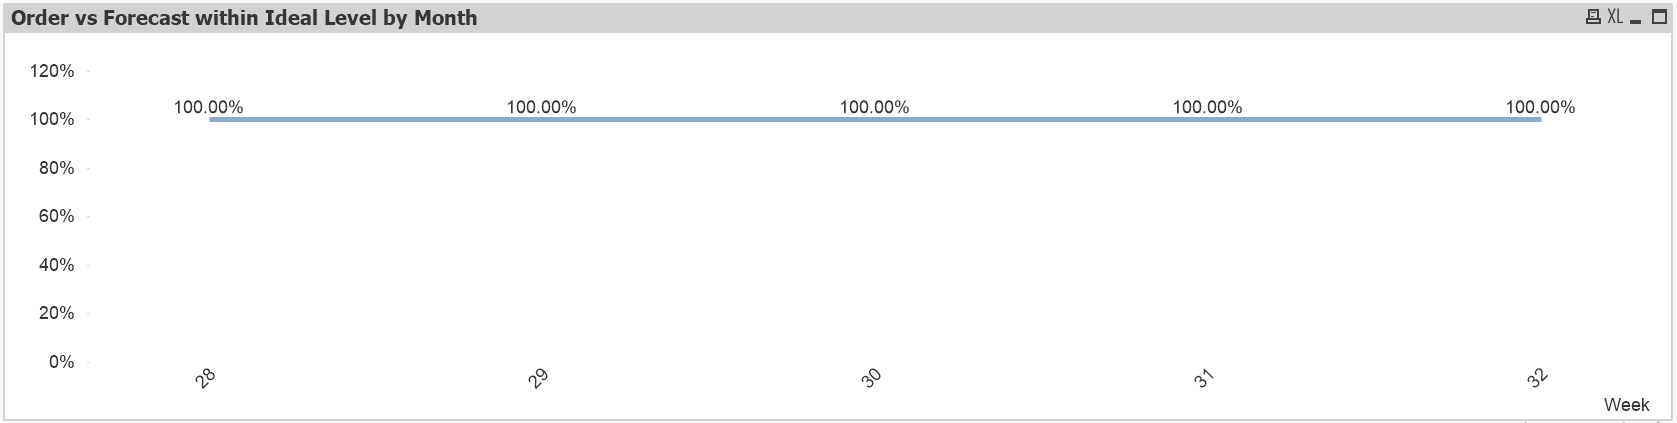
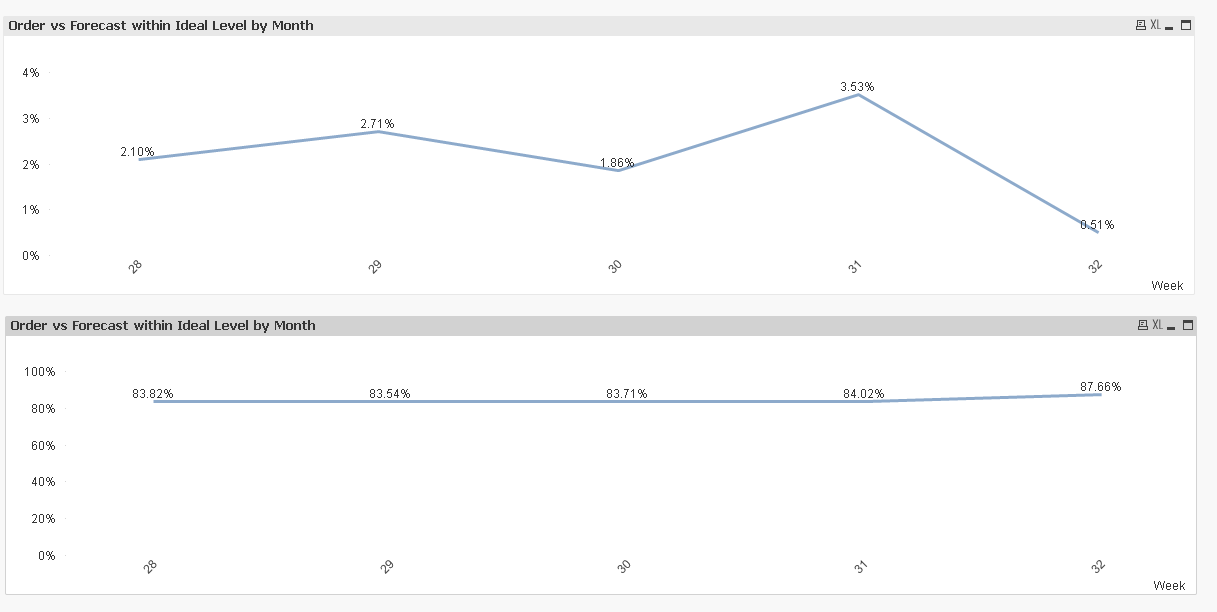
Now in the next sheet (Sheet4) we have another Line Chart. Which will show you:
(Values for Y) / (Values for X)
Could anyone help me to do this.
Thanks in advance for your help.
I am attaching the sample QVW.
Thanks,
Sarif
Accepted Solutions
- Mark as New
- Bookmark
- Subscribe
- Mute
- Subscribe to RSS Feed
- Permalink
- Report Inappropriate Content
May be this
=sum(Aggr(If(Sum(TOTAL <DIM_ITEM.ItemNumber> UnitsSold)*100/Max(TOTAL <DIM_ITEM.ItemNumber>ForecastQuantity) >= $(v_Min)
AND Sum(TOTAL <DIM_ITEM.ItemNumber>UnitsSold)*100/Max(TOTAL <DIM_ITEM.ItemNumber>ForecastQuantity) <= $(v_Max), Sum(LineSalesValue)), DIM_ITEM.ItemNumber, CstFiscalWeek)) /
sum(LineSalesValue)
- Mark as New
- Bookmark
- Subscribe
- Mute
- Subscribe to RSS Feed
- Permalink
- Report Inappropriate Content
I am not sure I understand what is the expected or needed output you are looking to get. Would you be able to elaborate and/or give the more information about the output you are hoping to see?
- Mark as New
- Bookmark
- Subscribe
- Mute
- Subscribe to RSS Feed
- Permalink
- Report Inappropriate Content
Thanks Sunny for replying.
We have sheet3,where we have Line Chart showing Sales Order vs Forecast against Item Number.
There are two Adjustable Lines in Red color, changing with Adjustable Slider.
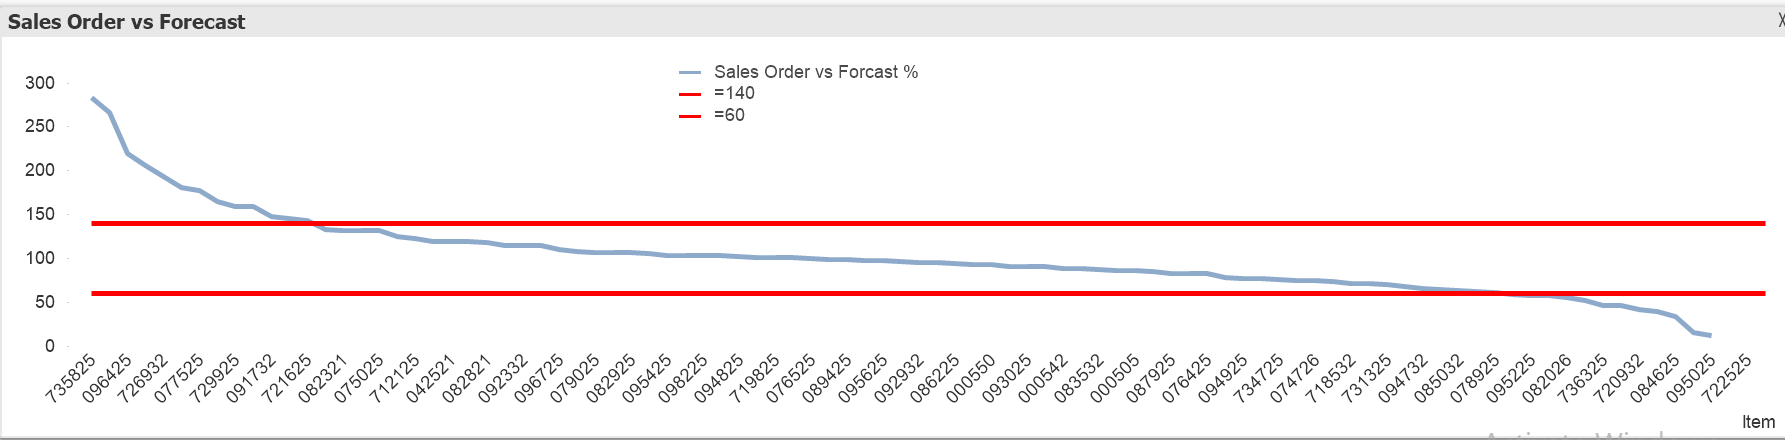
So there are few Items falling between two red lines (Lets assume no of Item falling between two red Lines = X)
And total no of Items present in this Chart (Lets assume no of Items = Y).
So in the Sheet 4, there is another chart, where we need calculation like below:
Sales for X no of Items / Sales for Y no of Items.
Is this understandable?
Please let me know.
Thanks in advance for your help.
Thanks,
Sarif
- Mark as New
- Bookmark
- Subscribe
- Mute
- Subscribe to RSS Feed
- Permalink
- Report Inappropriate Content
Not sure which one you want, but have a look
- Mark as New
- Bookmark
- Subscribe
- Mute
- Subscribe to RSS Feed
- Permalink
- Report Inappropriate Content
Thanks Sunny.. I need the second one.
This is coming correct.
But similar calculation I wanted for LineSalesValue also. But it is not working.
My Expression is like below:
I have added and attaching the qvw again. Could you please check my expression.
Thanks
Sarif
- Mark as New
- Bookmark
- Subscribe
- Mute
- Subscribe to RSS Feed
- Permalink
- Report Inappropriate Content
May be this
=sum(Aggr(If(Sum(TOTAL <DIM_ITEM.ItemNumber> UnitsSold)*100/Max(TOTAL <DIM_ITEM.ItemNumber>ForecastQuantity) >= $(v_Min)
AND Sum(TOTAL <DIM_ITEM.ItemNumber>UnitsSold)*100/Max(TOTAL <DIM_ITEM.ItemNumber>ForecastQuantity) <= $(v_Max), Sum(LineSalesValue)), DIM_ITEM.ItemNumber, CstFiscalWeek)) /
sum(LineSalesValue)
- Mark as New
- Bookmark
- Subscribe
- Mute
- Subscribe to RSS Feed
- Permalink
- Report Inappropriate Content
You have always been my life saver...and this time also.
Thank you so much Sunny. This is working perfectly.