Unlock a world of possibilities! Login now and discover the exclusive benefits awaiting you.
- Qlik Community
- :
- All Forums
- :
- QlikView App Dev
- :
- Seperating out a specific field from a set of data
- Subscribe to RSS Feed
- Mark Topic as New
- Mark Topic as Read
- Float this Topic for Current User
- Bookmark
- Subscribe
- Mute
- Printer Friendly Page
- Mark as New
- Bookmark
- Subscribe
- Mute
- Subscribe to RSS Feed
- Permalink
- Report Inappropriate Content
Seperating out a specific field from a set of data
Hi there, I hope someone can help...... again!
I have created a chart from following data sources held in a table called "Location_split_perc" giving the values in the chart.
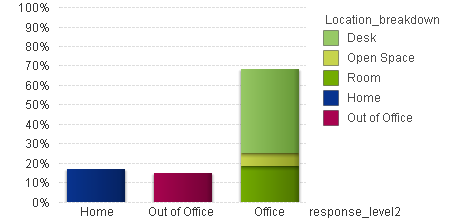
I want to create a text box object that pulls in the result from the "Location_split_perc" of only the "office"
How do I seperate out the other data or only select the three items within "Office" which are Desk, Open Space and Room?
Thanks
Rob
Accepted Solutions
- Mark as New
- Bookmark
- Subscribe
- Mute
- Subscribe to RSS Feed
- Permalink
- Report Inappropriate Content
Hi Rob,
You can use set analysis to only focus on one value, in this case 'Office'.
For example, if you want to count the instances of FIELDNAME where Location_split_perc=Office, the expression below would work:
=count({$<Location_split_perc={'Office'}>} FIELDNAME)
- Mark as New
- Bookmark
- Subscribe
- Mute
- Subscribe to RSS Feed
- Permalink
- Report Inappropriate Content
Johannes, that worked after a bit of swapping around and getting the fieldname and Location Split in the right place.
I also used Sum instead of count.
I was wondering how I could show this as a percentage - at the moment I have created a variable:
VarTotOfficeUtil - which is made up of the calculation below:
=sum({$<response_level2={'Office'}>}Location_split_perc)
And then used that in the Text Object to get the result 0.68
=Num(VarTotOfficeUtil,'#0.00')
Your continued help is appreciated.
Thanks
Rob