Unlock a world of possibilities! Login now and discover the exclusive benefits awaiting you.
- Qlik Community
- :
- All Forums
- :
- QlikView App Dev
- :
- Set Analysis - Aggregation Help
- Subscribe to RSS Feed
- Mark Topic as New
- Mark Topic as Read
- Float this Topic for Current User
- Bookmark
- Subscribe
- Mute
- Printer Friendly Page
- Mark as New
- Bookmark
- Subscribe
- Mute
- Subscribe to RSS Feed
- Permalink
- Report Inappropriate Content
Set Analysis - Aggregation Help
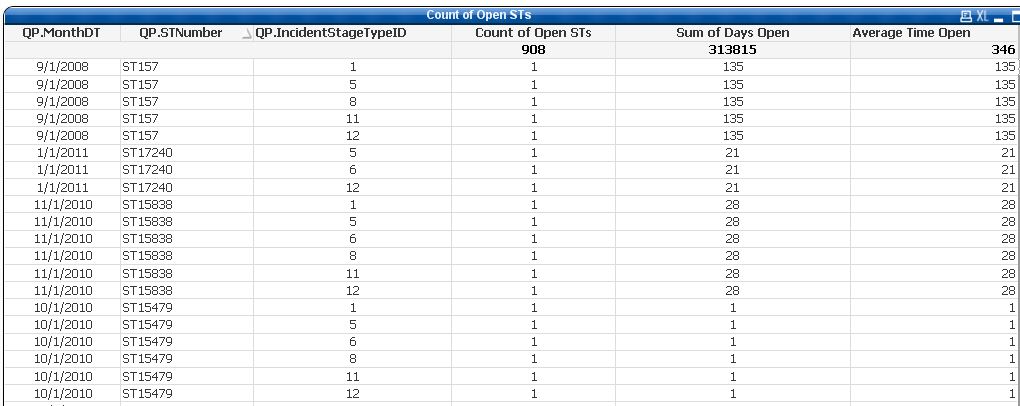
I've got a database that stores records into it. Each record is titled with a primary key, "ST####" and is shown in the image below of my chart table under the "QP.STNumber" column. You'll notice that the QP.MonthDT (The DATE the record was created) has the same date listed multiple times with the same QP.STNumber beside it. If you look in the third column, "QP.IncidentStageTypeID", there are different numbers for each of the repetative numbers.
e.g. On 9/1/2008, the record "ST157" was created. The reason the QP.STNumber is repeated multiple times is because there are
different QP.IncidentStageTypeID's within each record.
My intent is to aggregate the QP.STNumbers to one line item per number. So ST157 would only be one row item, as would ST17249, ST15838, ST15479, etc...
Notice the "Sum of Days Open" column is also repetative, such that it is the same number repeated as long as the ST# is repeated. For example, ST157 shows 135 Days Open. The "Count of Open STs" is 11111111111 for each row item, as well. So, ST157 should be shown one single time, the count should be 1 and the Sum of Days Open should be 135.
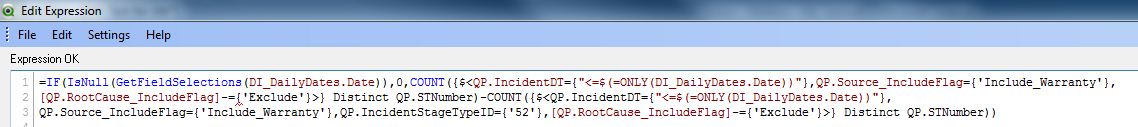
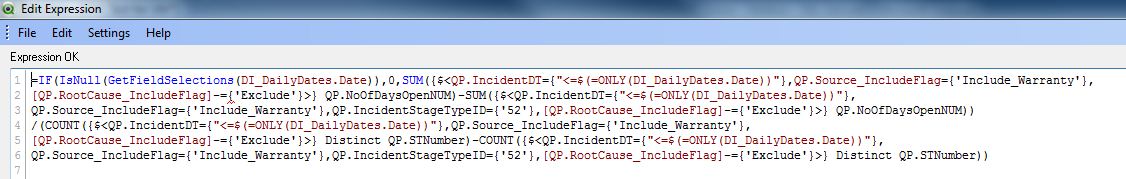
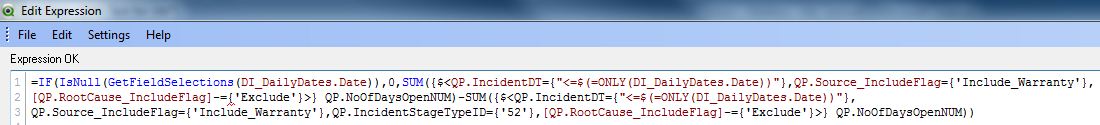
Please help me write set analysis to aggregate as I intend for the data to be shown. I'm including my set analysis for everything shown in the table chart as images below, as well.