Unlock a world of possibilities! Login now and discover the exclusive benefits awaiting you.
- Qlik Community
- :
- All Forums
- :
- QlikView App Dev
- :
- Set Analysis - Compare dates
- Subscribe to RSS Feed
- Mark Topic as New
- Mark Topic as Read
- Float this Topic for Current User
- Bookmark
- Subscribe
- Mute
- Printer Friendly Page
- Mark as New
- Bookmark
- Subscribe
- Mute
- Subscribe to RSS Feed
- Permalink
- Report Inappropriate Content
Set Analysis - Compare dates
Hi
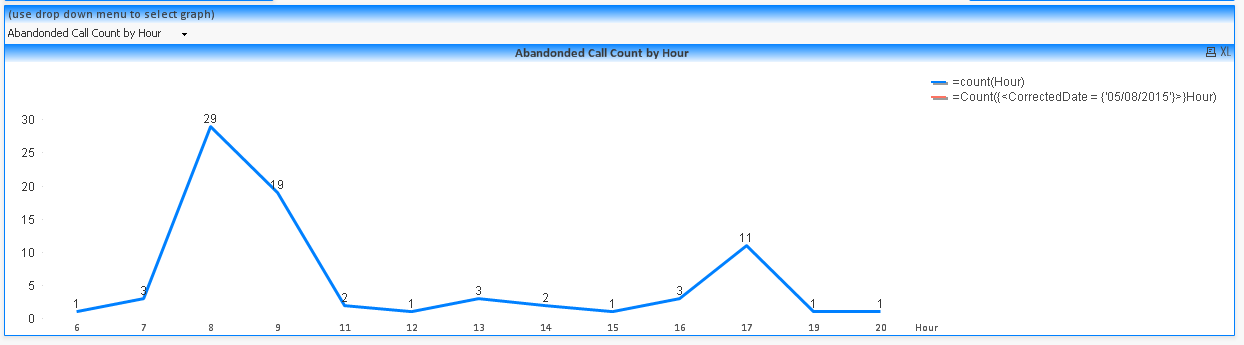
I have a line graph showing a count of data per hour of the day. I want to compare this to the value 7 days previous
I've used the following:
=count({<CorrectedDate={$(=(Max(CorrectedDate)-7))}>} Hour)
However, it isn't showing the 7 days previous figure on the line graph. Have I missed something?
- Tags:
- new_to_qlikview
- Mark as New
- Bookmark
- Subscribe
- Mute
- Subscribe to RSS Feed
- Permalink
- Report Inappropriate Content
Count({<CorrectedDate = {'$(=Date(Max(CorrectedDate)-7))'}>}Hour)
- Mark as New
- Bookmark
- Subscribe
- Mute
- Subscribe to RSS Feed
- Permalink
- Report Inappropriate Content
may be you have other selections that needs to be ignored?
count({<month=,year=,day=,CorrectedDate={$(=(Max(CorrectedDate)-7))}>} Hour)
hth
Sasi
- Mark as New
- Bookmark
- Subscribe
- Mute
- Subscribe to RSS Feed
- Permalink
- Report Inappropriate Content
May be this:
=Count({<CorrectedDate={"$(=Date(Max(CorrectedDate)-7), 'YourDateFormat')"}>} Hour)
- Mark as New
- Bookmark
- Subscribe
- Mute
- Subscribe to RSS Feed
- Permalink
- Report Inappropriate Content
Hi Sunny,
You meant this?
Count({<CorrectedDate={"$(=Date(Max(CorrectedDate)-7, 'YourDateFormat'))"}>} Hour)
- Mark as New
- Bookmark
- Subscribe
- Mute
- Subscribe to RSS Feed
- Permalink
- Report Inappropriate Content
Tried all answers. Still not showing the 2nd line
- Mark as New
- Bookmark
- Subscribe
- Mute
- Subscribe to RSS Feed
- Permalink
- Report Inappropriate Content
Post sample application pls
- Mark as New
- Bookmark
- Subscribe
- Mute
- Subscribe to RSS Feed
- Permalink
- Report Inappropriate Content
Yup, that is what I meant 